“War is ninety percent information.”
This quote by Napoleon Bonaparte applies to many aspects of life, not just war.
Success in mobile apps, for instance, is also about having the right information. It’s knowing your users, how competitor apps are doing, or the performance of your app.
And the best way to gather this data is through app analytics.
This beginner’s guide will go through everything you need to know about app analytics—including methods and best practices.
What is mobile analytics?
Mobile analytics deals with the collection of the data users leave behind when they’re using your app.
You then glean insights from that data to help improve your app’s engagement, user experience (UX), and performance.
Carly Fiorina, the former HP CEO, sums up the gist of mobile analytics:
“The goal is to turn data into information, and information into insight.”
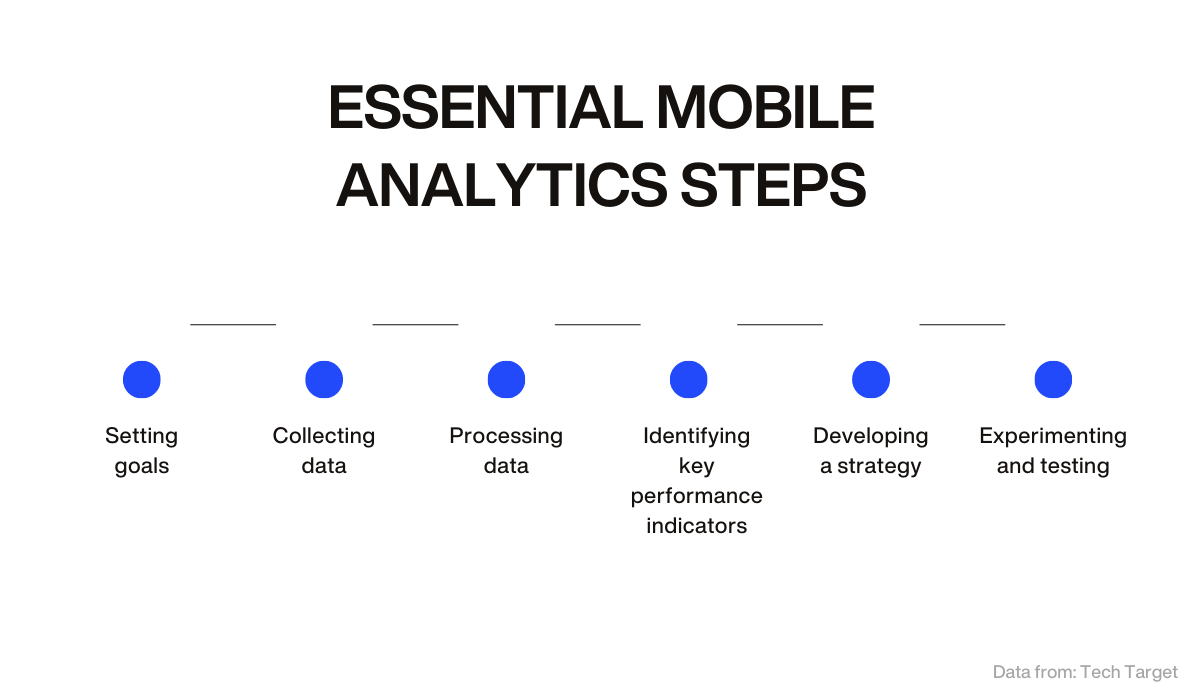
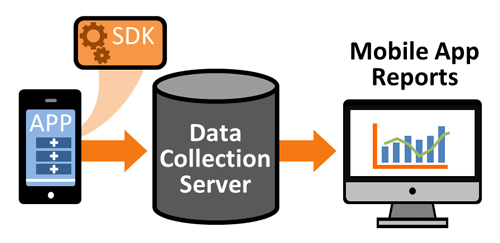
Here’s what the analytics process looks like.
Source: DECODE
It begins with setting goals. This is an essential step because you first need to know what you’re trying to improve before you can measure it.
Next, data is collected, often with a piece of code or software integrated into your app. It’s done in the background automatically and sent to the developers.
The raw data is then processed into insights or graphs for easier interpretation.
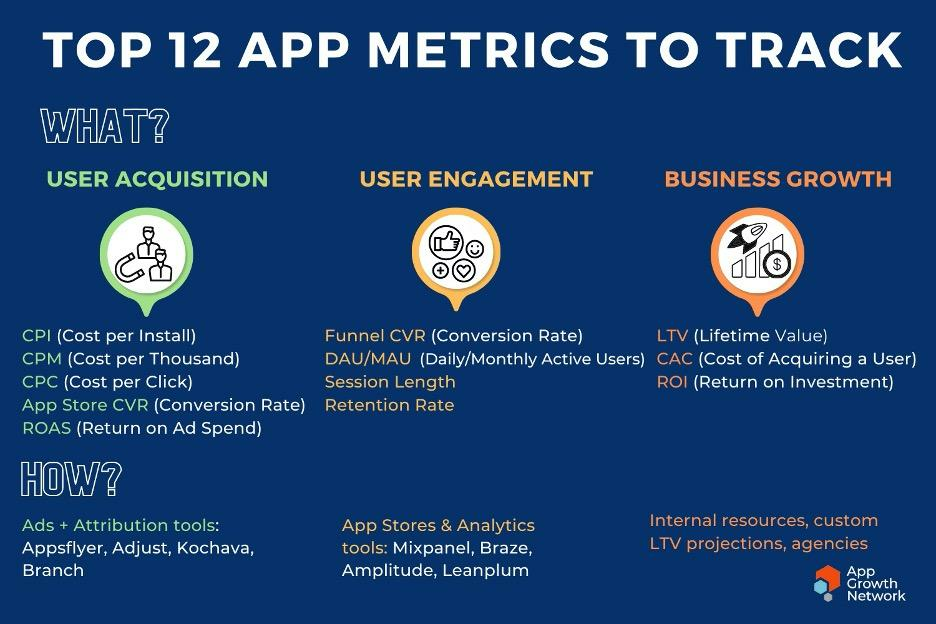
The development team then identifies only the metrics relevant to their app’s key performance indicators.
That data has the biggest impact on your app and therefore deserves the most attention.
Source: App Growth Network
Using the key insights, new strategies are formed and applied to the app. This leads to a round of testing and experimentation to verify the changes.
The process then goes backward, with testing driving new strategies, KPIs, and data collection.
Essentially, the process is a loop instead of a linear path—encouraging continuous evolution and improvement.
This is just an overview of the steps involved in analytics. We’ll delve into each one as we go through the rest of the article.
Why is mobile analytics important?
Mobile analytics give you a complete picture of your user’s behavior while they’re inside your app. Knowing this can help you fix issues quickly and spot opportunities for optimization.
Legendary business management guru Peter Drucker’s famous quote comes to mind:
“You can’t manage what you can’t measure.”
In other words, you can’t tell whether your app is successful or not until you measure the key metrics.
Analytics are crucial to get a true picture of your app’s ROI and profitability.
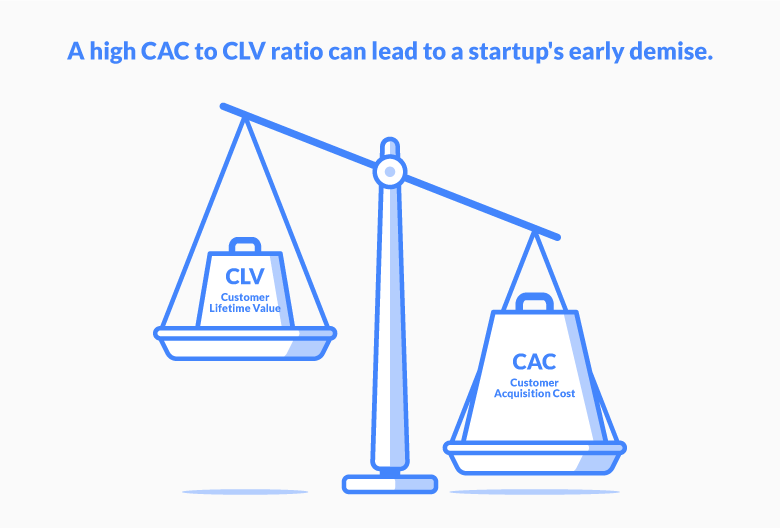
Most apps measure profit potential using two metrics. One is the customer acquisition cost (CAC) which estimates how much the business spends to get one app user.
The other is the customer lifetime value (CLTV), or the total revenue brought in by that user while using the app.
An app with a CAC higher than the CLTV indicates that it’s losing money. This is why the number of downloads as a success metric can be misleading.
If you’re overspending to get more downloads, your app can still be unprofitable.
Source: Business2Community
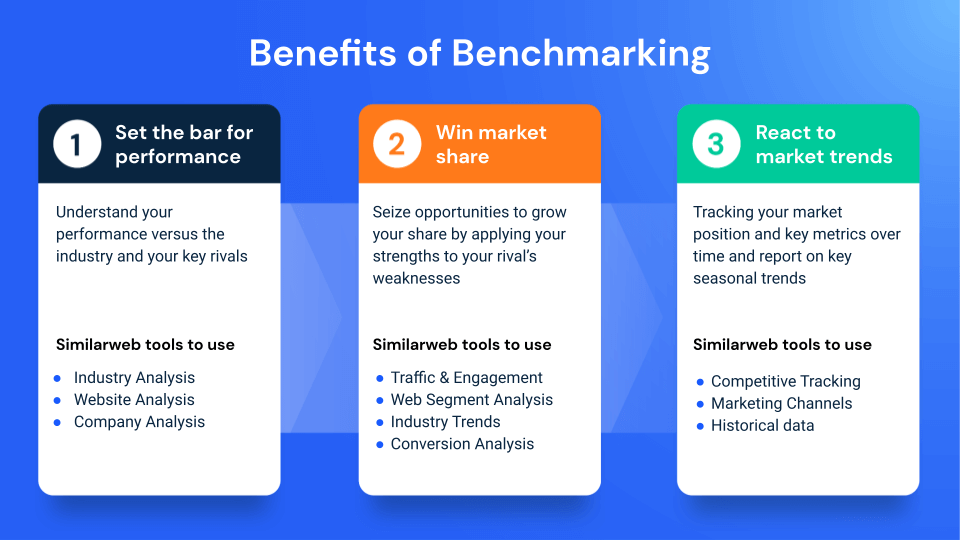
Analytics is even more useful when you use it to benchmark your app against competitors because it gives you a better perspective on your app’s performance.
Source: Similarweb
For example, you might think a retention rate of 30% is fantastic for an app in your industry.
But if your closest competitor is achieving 55%, they’ll eventually outpace you, especially if you cater to the same users.
But probably the best benefit of analytics is that they help you achieve the best UX for your app without spending unnecessary time and resources.
Data collection methods in mobile analytics
The main method of collecting analytics data in a mobile app is through a software development kit or SDK.
An SDK is a software library that developers insert into the app’s code. Once there, it can monitor app events, such as when users tap on a button or buy an in-app purchase.
Developers can specify which data they want to track and record.
Source: Analytics Hero
SDKs offer an easy approach because data is automatically collected and sent to the developer. There’s no need to disrupt the user experience when collecting data.
However, in some instances, directly involving the user is not only possible but also advantageous.
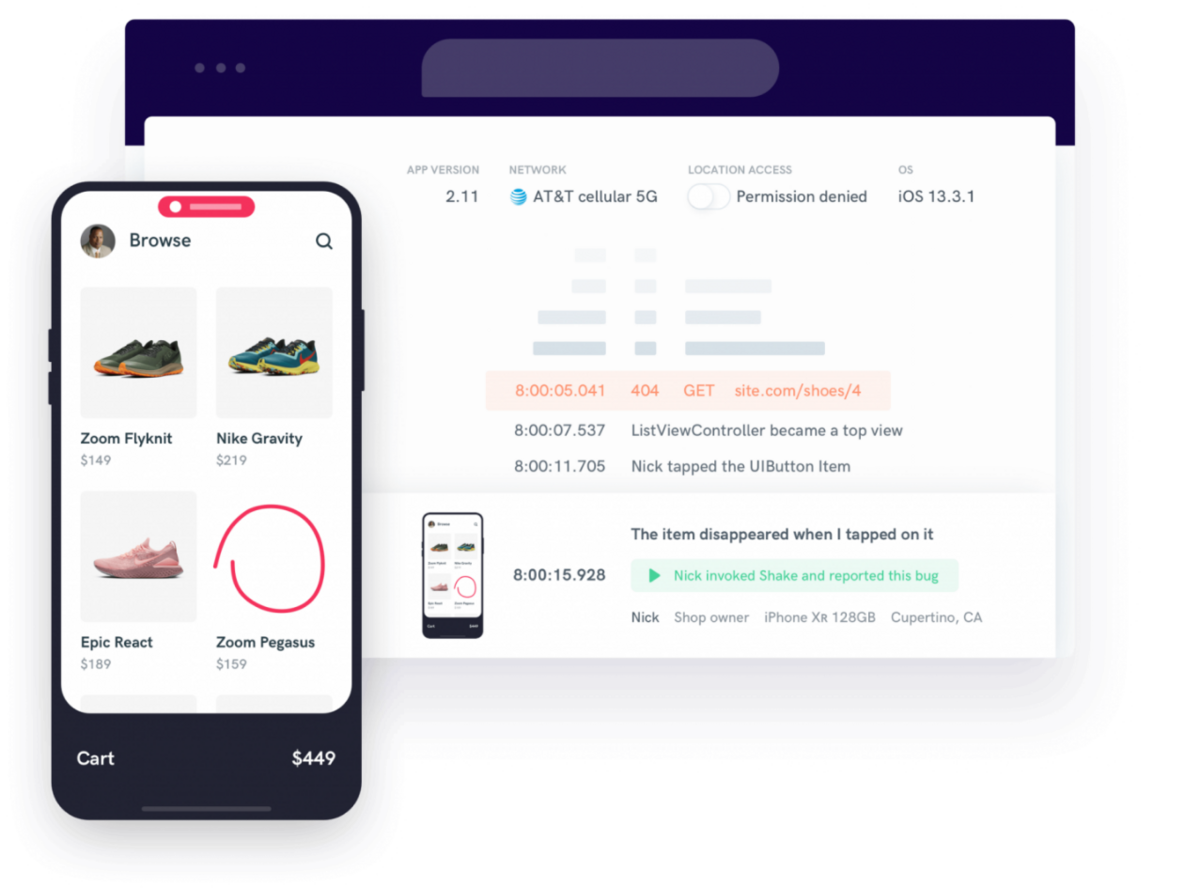
For example, Shake is an analytics tool that allows users to report bugs, send feedback, and even ask questions.
Everything is done within the app to minimize disruptions to the user flow.
Source: DECODE
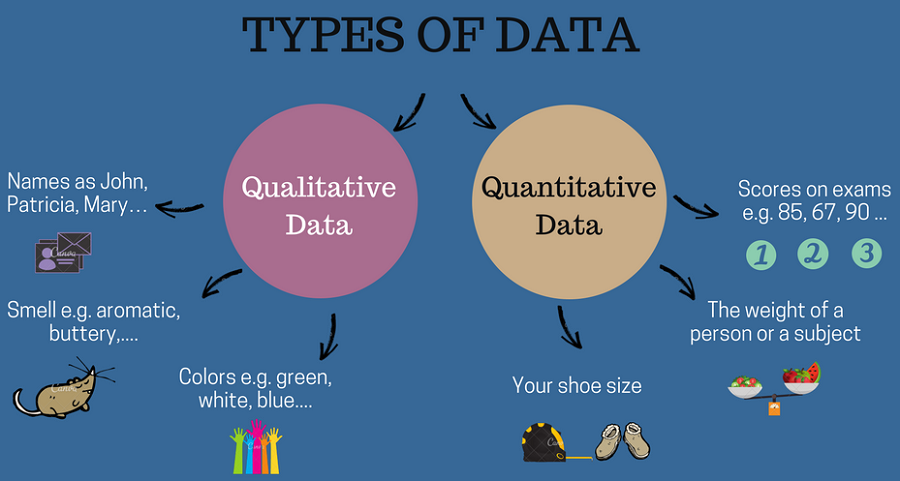
The beauty of this method is that it provides qualitative data that can give much deeper insights than mere numbers can provide.
For instance, observing low retention rates tells you that your UX might be lacking but not how to fix it.
Qualitative feedback will let you know exactly what’s wrong because you’ll hear it straight from the user.
Source: IntellSpot
But overall, you need both qualitative and quantitative data in your analytics program. Hence, it’s best to incorporate as many collection methods as possible.
Common goals for mobile app analytics
As we mentioned, setting goals is important in mobile analytics.
That’s because you’re guaranteed to swim in a sea of data that will quickly overwhelm you. Goals are like a map.
They tell you the data you need to get to your desired destination so you can focus on them.
Your goal determines which data you should track – then ignore the rest.
Most goals generally fall under one of these three categories.
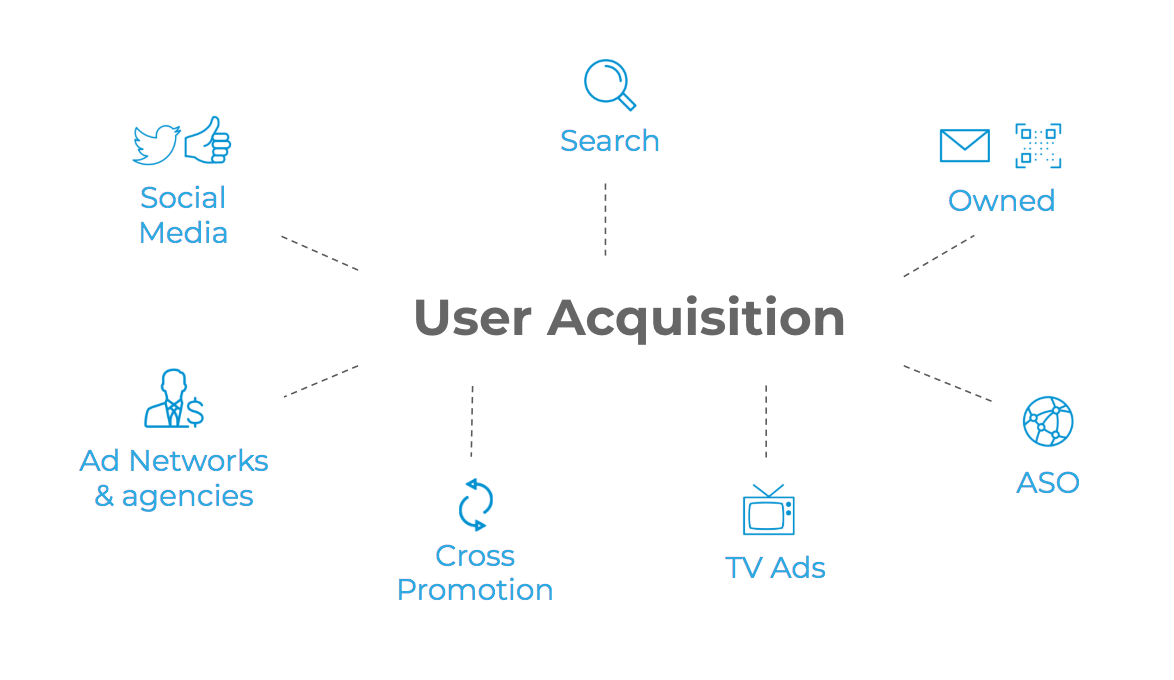
First is user acquisition or getting as many users as possible cost-effectively. This is mostly a marketing-oriented goal.
Thus, its metrics focus on evaluating ad campaigns and app store optimization (ASO) strategies.
Source: AppsFlyer
The second is user engagement and retention. This is your goal if you want to keep users in your app through fantastic UX.
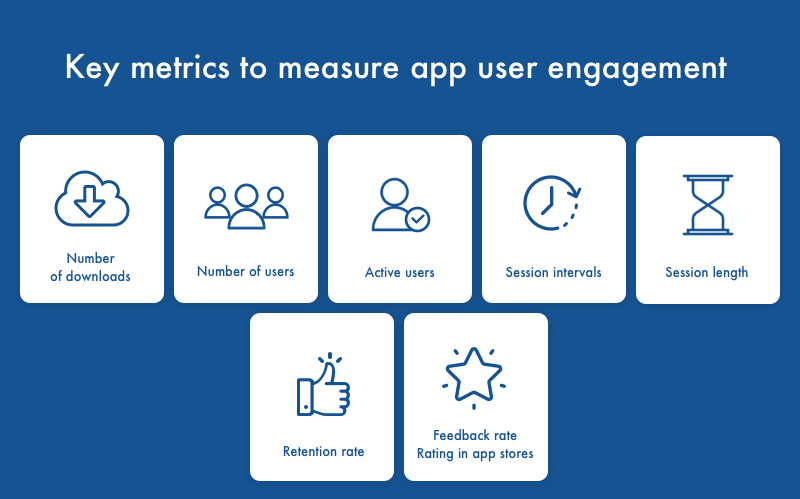
Metrics cover usability issues like retention rate, session length, and social interactions. They could also deal with technical problems like load times and crashes.
Source: CleverRoad
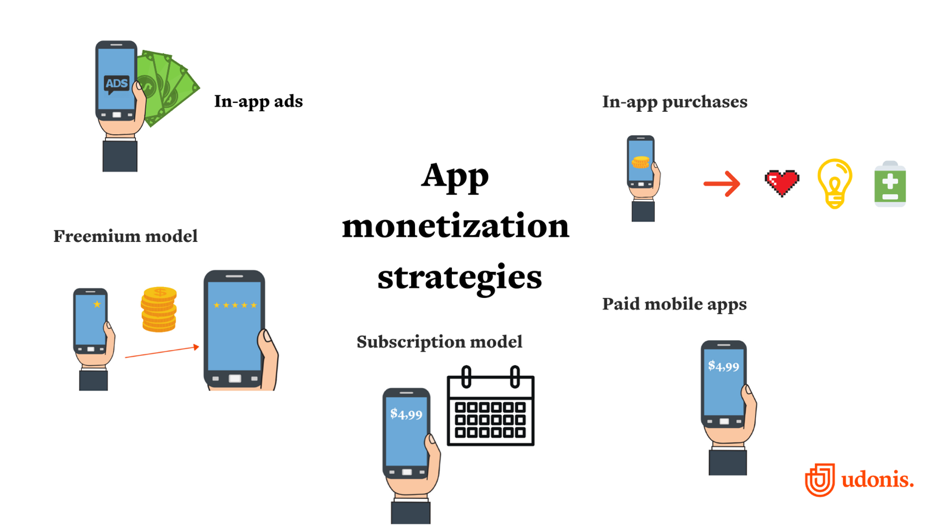
Lastly, you have monetization, which is suitable if you already have a stable user base and now want to earn more revenue from them.
The exact metrics here will vary depending on the monetization strategy you use.
Source: The Manifest
The important thing to note here is that different apps will have different goals.
That’s because each has a unique combination of users, strategies, business models, and monetization methods.
Mobile games, for example, want to keep users playing for as long as possible.
This is especially true for free games because the longer a player is in the game, the higher the chances for in-app purchases.
Fintech apps aim for the opposite. They want to keep retention rates up but reduce the average time spent per session.
Picking a suitable goal boils down to knowing the purpose of your app and understanding your users.
Mobile app analytics metrics
Now let’s discuss a few metrics and their purpose for analytics.
The most important is the retention rate, which measures how many active users you have.
It’s a good indication of your app’s success because the more users stay with you, the more engaged they are. And the higher the chances for in-app purchases.
You can compute the retention rate with the formula:
Number of active users/number of app installs
On the opposite side of the retention rate is your churn rate, which is the number of users that stop using your app.
An increasing churn rate can indicate a UX or technical issue with your app that you need to resolve.
You can easily derive your churn rate by subtracting your retention rate from 100%. Alternatively, you can use the following formula:
Source: DECODE
You can also measure app usage frequency through the daily active users (DAU) and monthly active users (MAU) metrics.
Combined, they can measure your app’s “stickiness,” which indicates the percentage of power users you have.
Whether you use DAU or MAU depends on the nature of your app. For apps like games that involve daily interaction, DAU is better.
But if the app is meant for infrequent use, MAU is a more accurate metric.
Lastly, you have average session length, which tells you how long a user spends in your app per session.
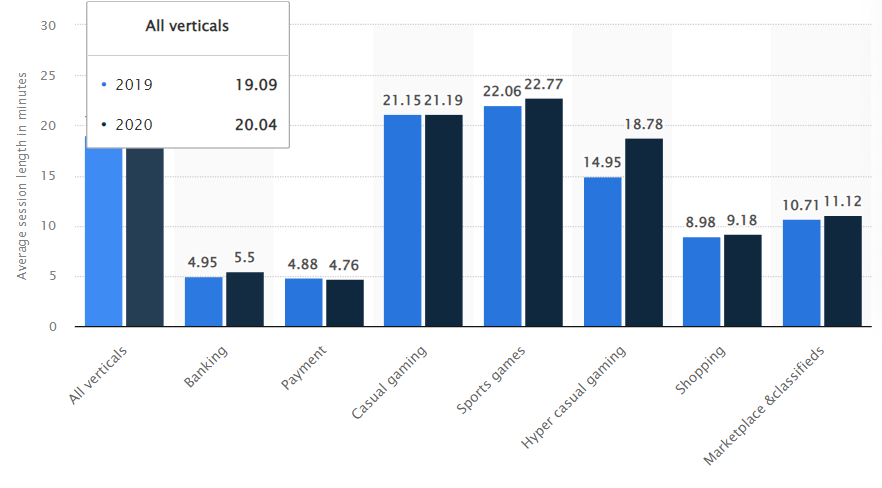
In most cases, longer sessions can indicate better engagement, but not always. Some app categories generally have shorter durations, as this chart shows:
Source: Statista
For example, banking apps often involve quick sessions. Longer durations might indicate a usability problem.
There are just some of the many metrics available to app developers. You can check out the other essential metrics in our article here.
How mobile app analytics work with user privacy
At some point, your analytics will need to gather personal data from the user. Thus, you need to have data privacy and security at the forefront.
The cost of a data breach is astronomical. Not only will it break your users’ trust, but it can also violate regulations that will lead to hefty fines.
This is especially true if you handle financial data like bank accounts and credit card numbers.
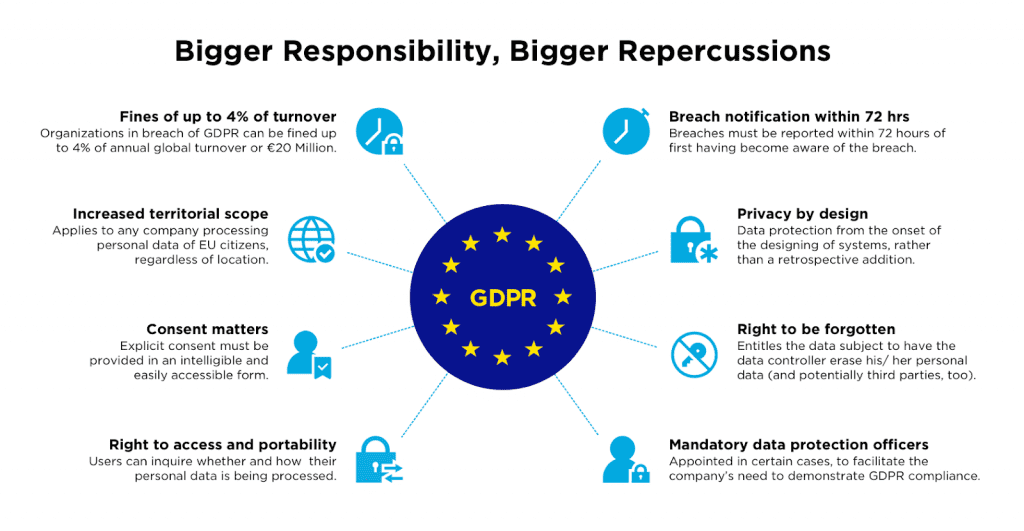
For instance, the European Union has the General Data Protection Regulation (GDPR), considered one of the world’s strictest data privacy laws.
Fines can reach up to €20 million—a crippling amount for any app.
Source: Emotiv
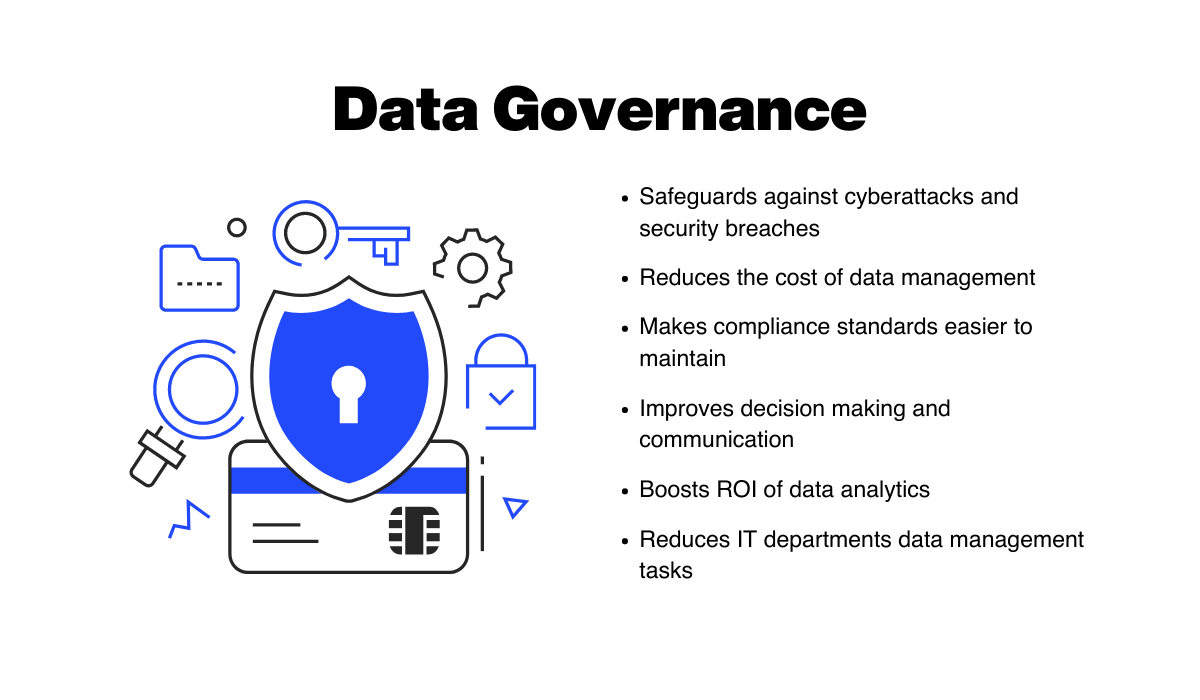
To prevent this from happening, it’s worthwhile to have data governance in place. It’s a collection of rules, processes, and systems to handle data that promotes security and privacy.
Source: DECODE
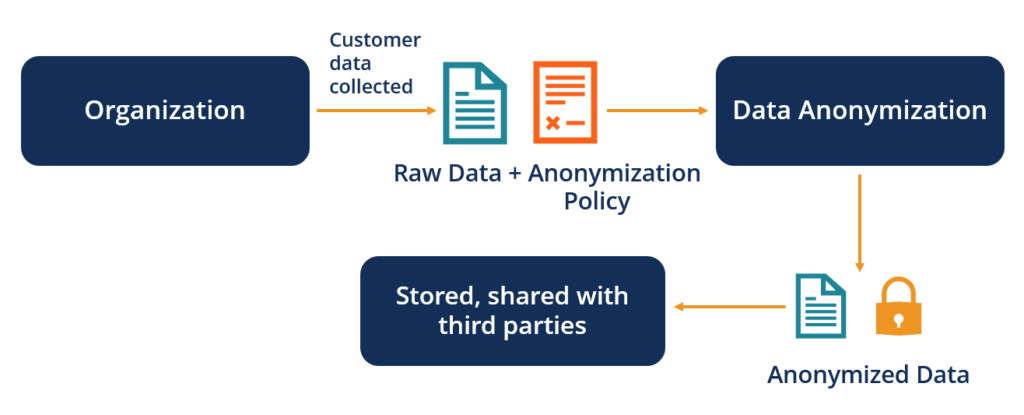
One of the key approaches here is anonymization, which removes any information that can be used to identify the data’s owner.
It’s a good practice to preserve confidential information when combined with other methods like encryption and tokenization.
Source: Corporate Finance Institute
Data privacy and security should be a top priority for any app, regardless of the confidentiality of the data gathered. It’s simply a good practice that can foster trust with users.
Mobile app analytics tools
For the most accurate data, you need the best analytics tools to help you out. Here are some you can consider.
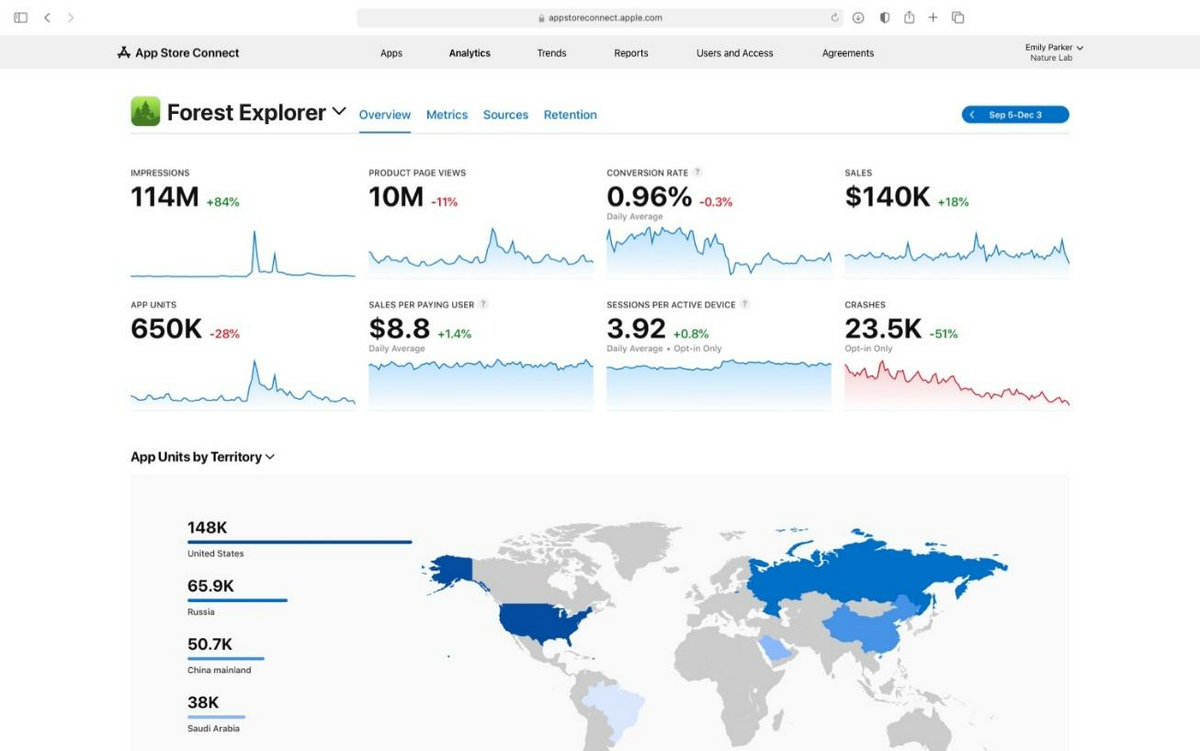
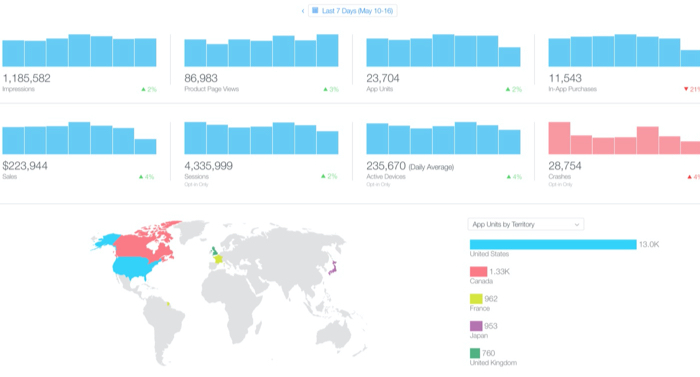
Most people start with solutions that are “native” to their chosen platform, such as Apple’s App Analytics platform.
For iOS developers, it’s one of the easiest ways to access insights like retention and user engagement.
You can also monitor your app store performance metrics, which is one of the strengths of this platform.
The good thing about this option is that it’s free and requires no setup. However, the metrics aren’t as in-depth as other paid options.
Source: Apple
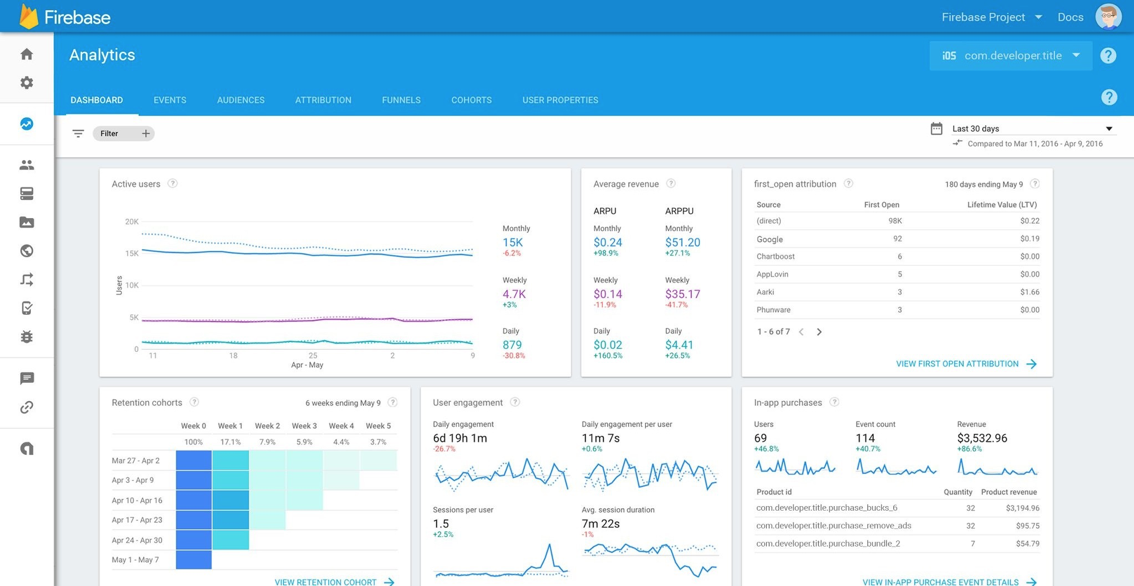
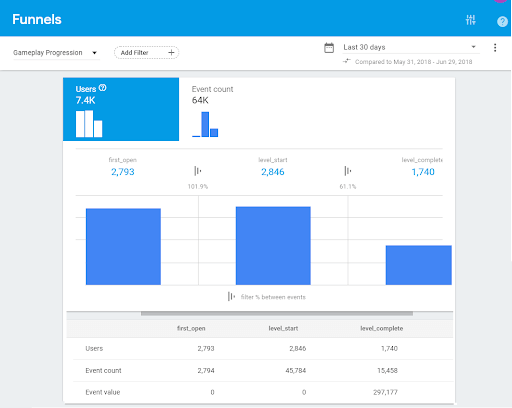
For Android developers, you have Firebase, Google’s all-in-one app creation, and analytics platform.
It’s a relatively more robust option than the iOS version, with the ability for advanced testing like A/B splits. It also integrates well with Google Ads.
Source: Ashish Fagna | Medium
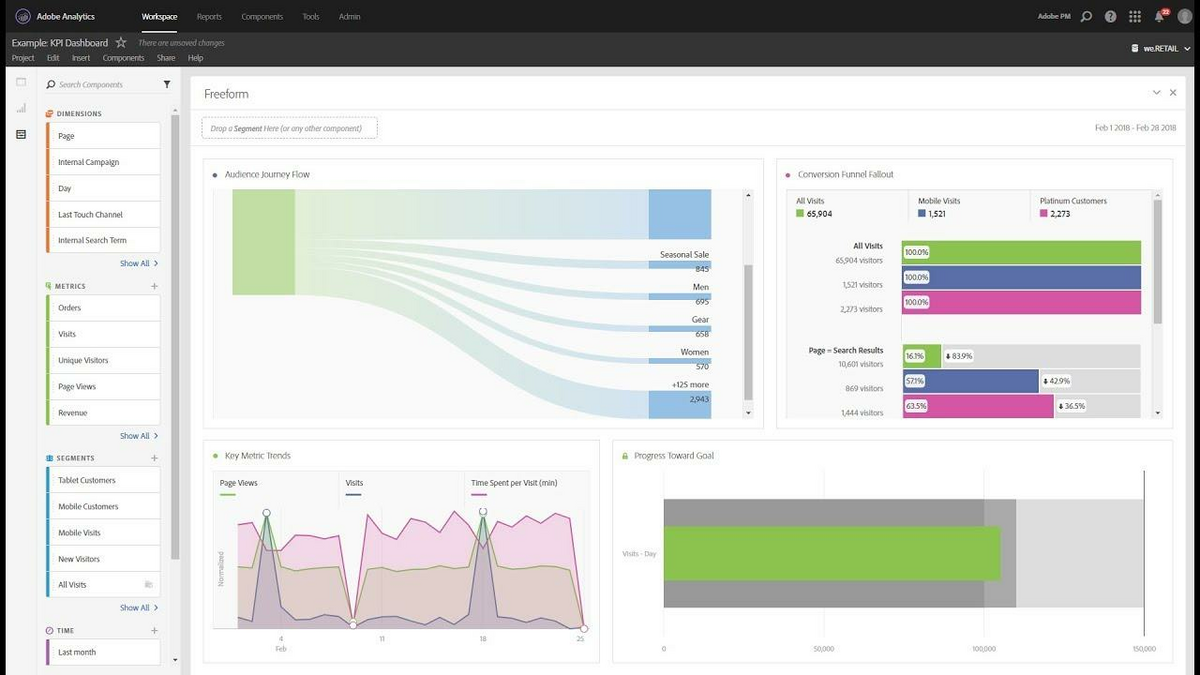
Adobe Analytics offers a more in-depth tool that’s suited for advanced users. It provides a much more comprehensive solution covering a much wider spectrum in the customer journey beyond apps.
The use of AI for predictive analysis can also reveal hidden insights.
The only drawbacks are its high price and complex UI.
Source: Adobe Analytics | YouTube
There are many more examples worth considering that can’t be covered in this short section. To discover more tools, you can read about them in this article.
How to analyze mobile app data
Your main resource when looking at analytics data is the report. This is raw data that’s presented in a visual format so that it’s easier for you to interpret and draw conclusions.
It can be in the form of charts, graphs, and tables.
For example, you can use the data below to figure out which users are responding to your app store optimization (ASO) strategies, then replicating it elsewhere.
Source: Neil Patel
But two reports are particularly useful for analyzing app data—funnels and user flow reports.
Funnels are useful for analyzing where users drop off in the customer journey. The example below shows how many users finished the first level of a mobile game versus how many started.
This can tell you if the game is too difficult and frustrating for users.
Source: Tatvic
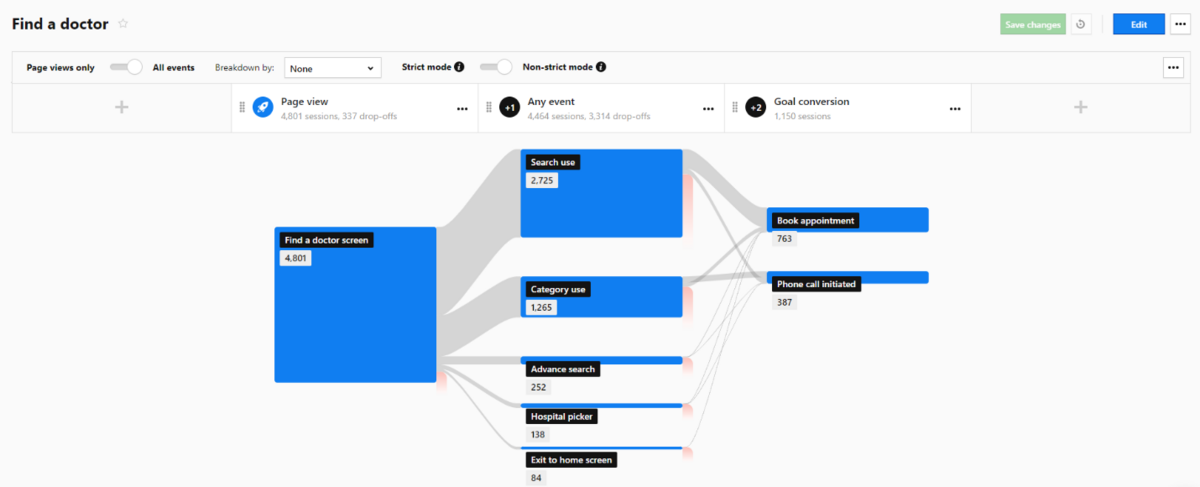
Flow reports, on the other hand, tell you how users get from point A to B in your app. Here’s an example from a medical app that allows users to book doctor appointments.
It indicates that most users get to the “find a doctor” feature via searching instead of app navigation.
Source: Piwik Pro
This can indicate that the app has a confusing navigation scheme. You can then use these findings to optimize that section of your app.
The beauty (and challenge) of analytics data is that there are multiple ways to interpret, combine, and apply them. That gives you plenty of angles to optimize your app.
Ready for app analytics?
Analytics can be a challenging aspect of app development. Going through a barrage of data and picking the right one can be daunting. Not to mention interpreting it properly.
But it can also be rewarding. Nothing is more fulfilling than seeing your retention numbers increase after you’ve implemented your insights based on analytics.
We hope this primer has armed you with the knowledge to forge ahead with your app’s analytics program.

