
The ultimate guide to mobile analytics
This guide will help you learn everything you need to know about mobile app analytics, including methods and best practices.
To date, there are 4.83 million apps available in the Apple App Store and Google Play Store.
The key to surviving and thriving in such a competitive environment is to deliver the best user experience (UX) among your competitors.
You can’t do that without analytics.
Analytics gives you the data and insights to refine your app, guiding your limited time, energy, and resources toward the things that matter.
Here are five best practices for doing app analytics right.
Like anything else in your app, analytics must be incorporated throughout development. In fact, many experts advise thinking about it as early as the design stage.
Peter Adams, Head of Performance Marketing at Shell, agrees:
“Make sure you know what you want to know at the design stage.”
But what does design have to do with analytics?
Foundational design principles state that designers should treat UI design like components on a page, in order to accommodate analytics methods later on easily.
Let’s take an A/B test, arguably one of the more useful analytics methods you’ll use.
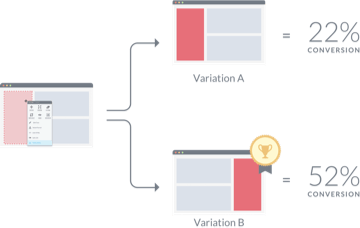
Source: UX Movement
A/B split tests are all about evaluating different variations of your app. This can be anything from a major layout change to a simple image swap.
Now, if you didn’t plan for A/B tests ahead, then creating each variation might require extensive coding or revisions.
This can make the test unnecessarily tedious and time-consuming to perform, hindering your analytics.
But if you have analytics at the forefront, you’ll approach app design differently. Maybe you’ll adopt a modularized approach so that you can easily play around with your layout for A/B tests.
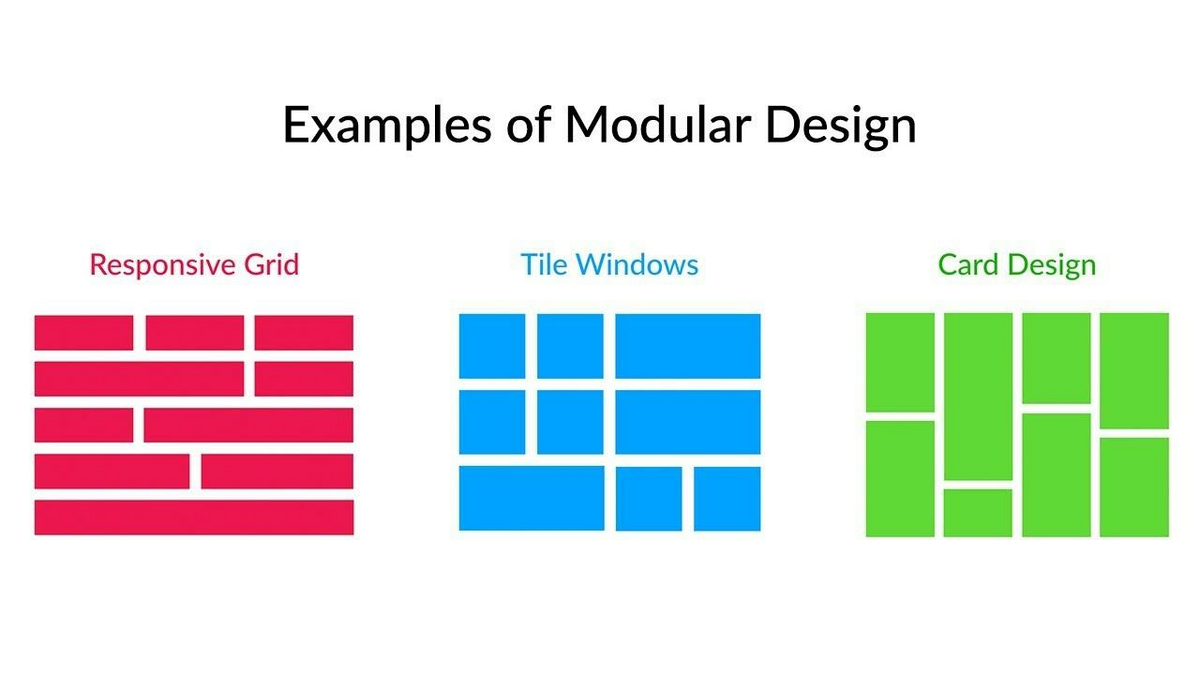
Source: Bitovi UX and Design | YouTube
It’s important to think about getting your app analytics-ready, even if you don’t have any plans to implement them yet.
You might not think about A/B testing now, but who knows when you’ll need it in the future. It pays to be ready.
Thinking of analytics early also helps you avoid technical debt—the added cost of implementing a feature later because you chose to sacrifice it early in the process.
Often, this is done to speed up development.
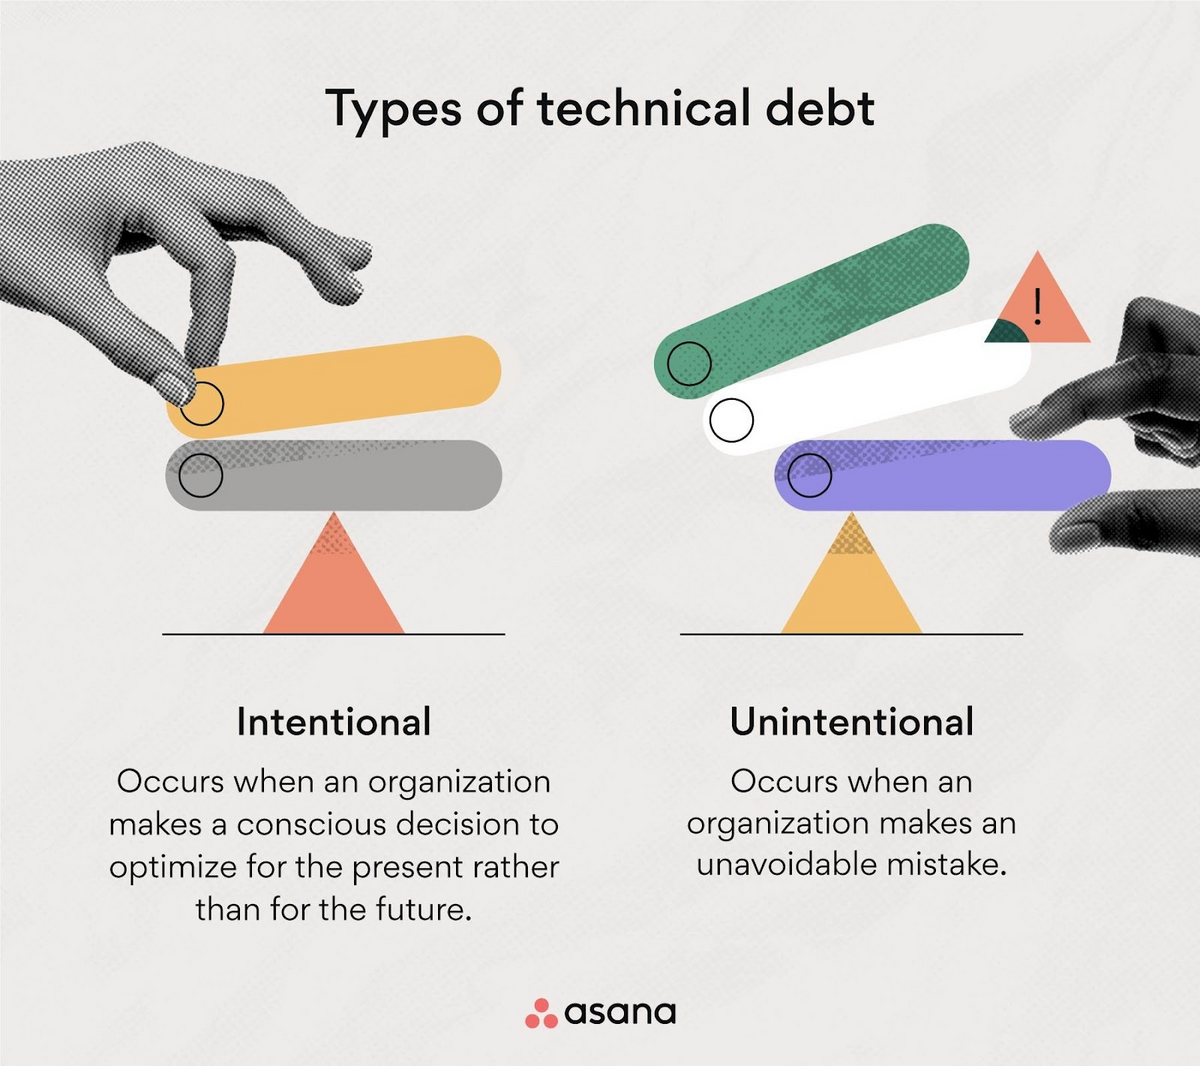
Source: Asana
Thinking about analytics early in the process might seem time-consuming and unnecessary, but you’ll eventually need it.
And unless you think of it on time, when you do, you’ll need to make costly revisions to your app code to incorporate it.
Indeed, technical debt is the number one reason many companies find it hard to innovate and react to market changes.
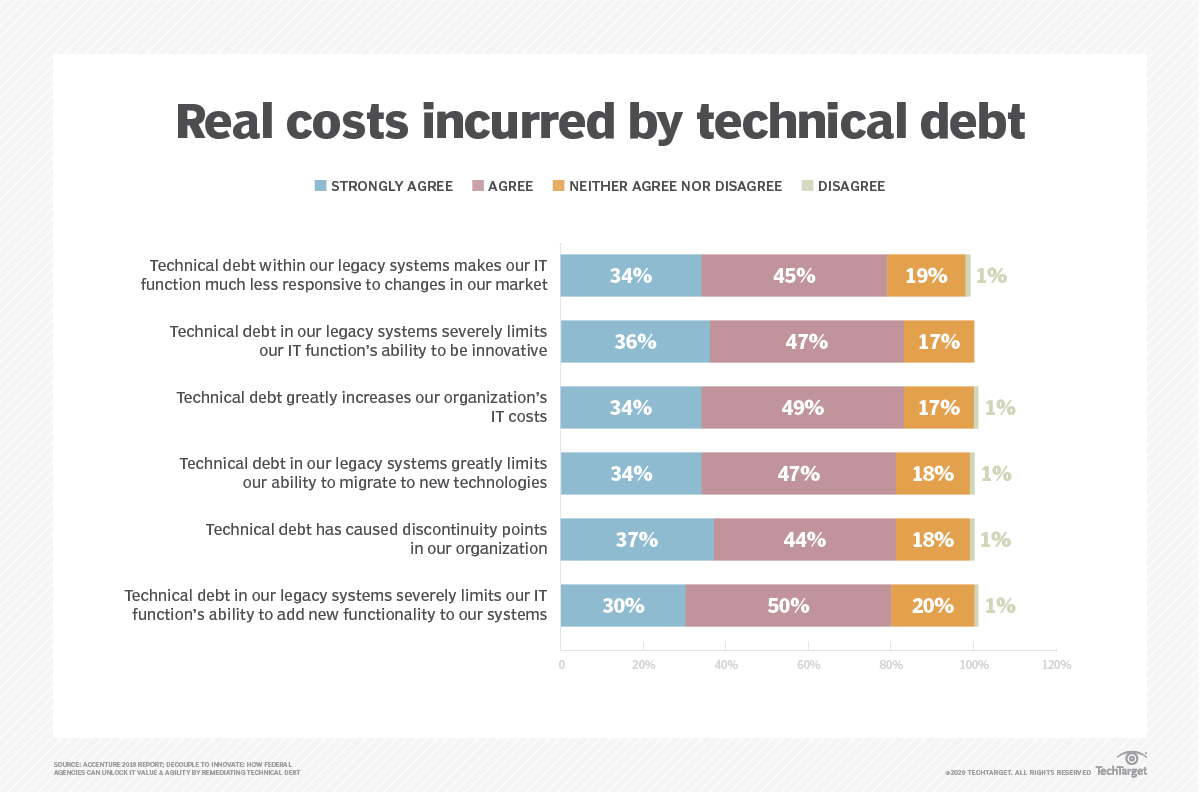
Source: Tech Target
The truth is that you can’t just slot in your analytics process after development, as many do. You won’t be able to maximize it that way.
Instead, you should plan for it just like any other app feature, so it can work harmoniously with the rest of your app ecosystem.
Knowing which app metrics to focus on is an important decision to make early on.
One common mistake many app developers make is to collect and analyze every app metric available to them.
Many of these are vanity metrics—they seem important but don’t actually give insights into your app’s performance.
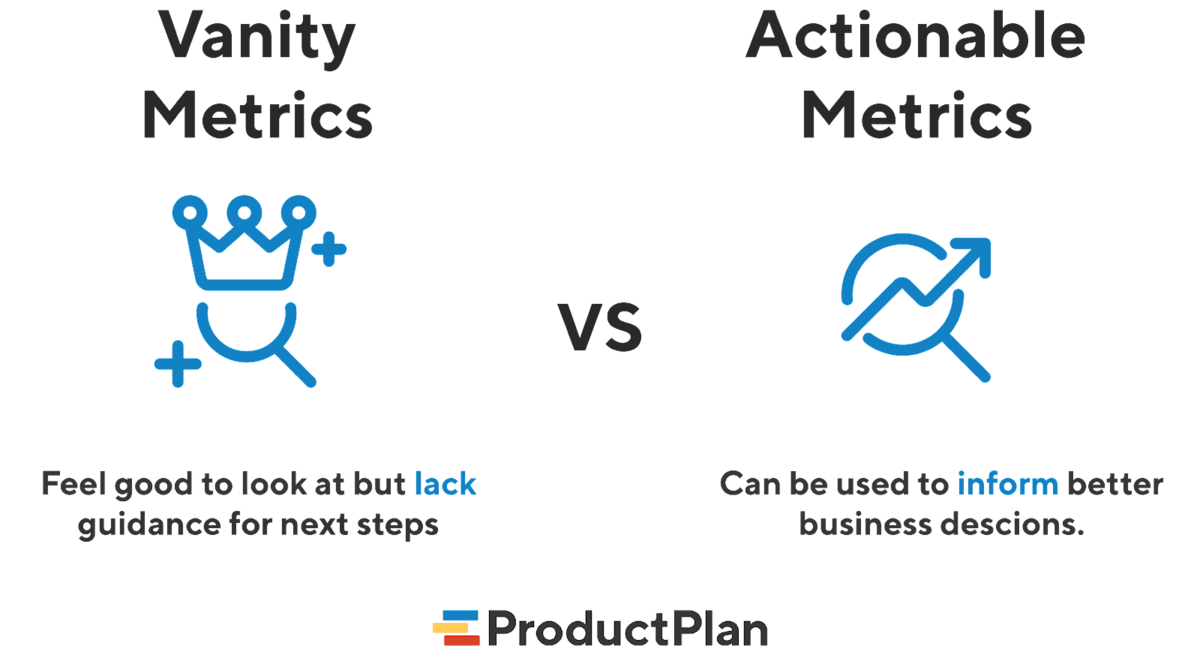
Source: ProductPlan
Focusing on vanity metrics can be a big waste of time, plus it can overwhelm you with too much data. Worse, it can give a false sense of success.
App downloads are a good example of this. Sure, a high number of downloads can indicate that your app is gaining traction.
But relying solely on downloads as the primary metric won’t show you the real indicators of app success—things like retention and churn.
The best way to avoid vanity metrics is to start with your business goals. Do you want to increase revenue this year, or do you plan to focus on growing your user base first?
Afterward, find the metrics that can measure those goals—or what the business world calls key performance indicators (KPI).
A good practice is to organize these in a tracking plan, which lets your team know which metrics you’re focusing on.
Source: Ruben Ugarte
To give you an idea, here are some common app goals and the metrics you can use to measure them.
Increasing user engagement and retention is probably at the top of every app developer’s mind.
It’s a better success goal than user acquisition because it focuses on active users, which drives the revenue and monetization of your app.
Of all the metrics that measure engagement, the most crucial is the retention rate or the percentage of your active users over a set period.
This is a better measuring stick than the download rate because it’s relatively easy to ask people to install an app (especially if it’s free) but harder to keep them using it.
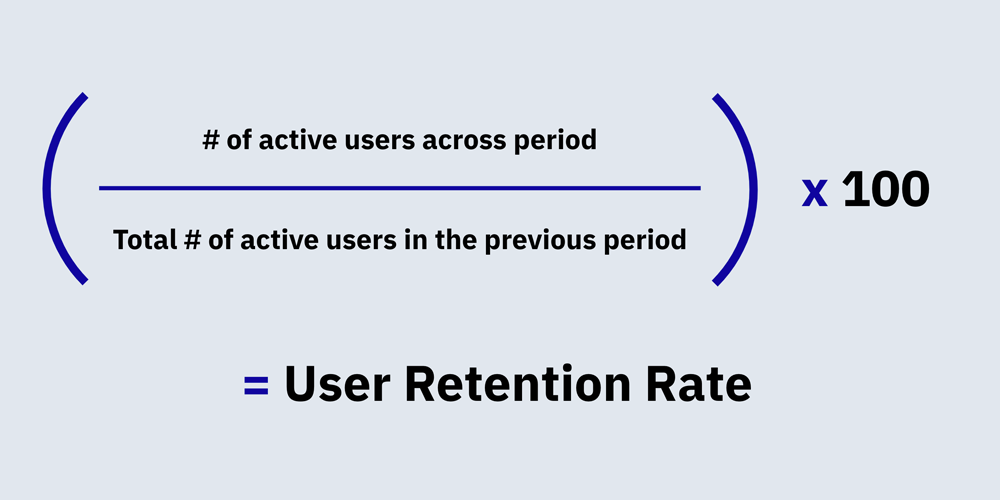
Source: Amplitude
The churn rate is the opposite—it measures how many users uninstall your app.
An exceptionally high or increasing churn rate indicates a major flaw with your app’s UX or engagement.

Source: DECODE
Let’s look at another common app goal—achieving the best user experience (UX).
This often goes hand-in-hand with engagement since improving UX will solve many retention and churn issues.
There are many performance metrics to measure specific UX aspects of your app. App load times are fundamental since 85% of users uninstall an app if they wait too long.
Crash logs are also helpful for spotting and fixing bugs quickly.
Lastly, there’s probably the critical goal for most firms—to increase revenue. Because apps employ different monetization strategies, your metrics will depend on which one you pick.
But whichever approach you choose, measuring your customer lifetime value (CLTV) is vital.
CLTV tells you how much revenue a user brings over the entire time they use your app. The higher your CLTV, the more money your app is earning.
Combined with a cost metric like customer acquisition cost (CAC), it can tell you how profitable your app is.
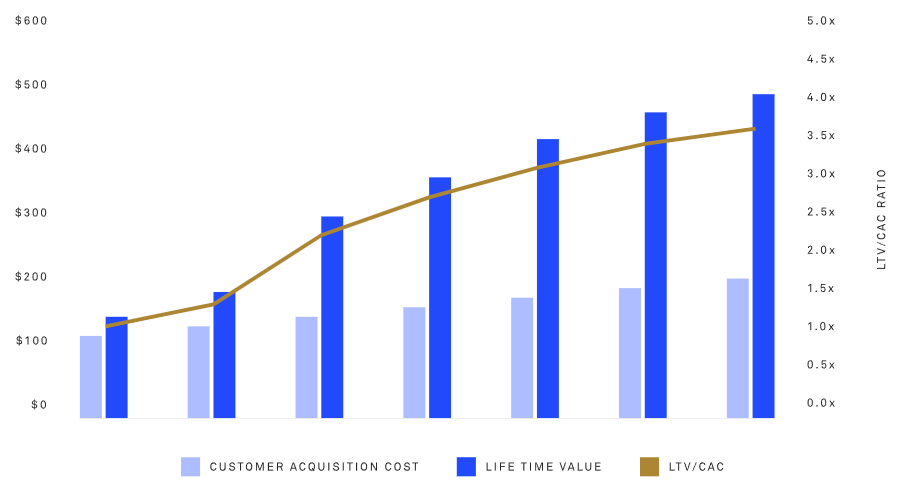
Source: DECODE
We’ve barely scratched the surface of the essential metrics you can track in your app. If you want to learn more, you can check out our article here.
The ability to track the metrics that matter relies greatly on your understanding of your user’s journey. After all, if you don’t know your users, you won’t know what to measure.
Iain Russell, the App Marketing Manager of Moneyhub, sums it up best:
“Having a clear understanding of who your users are and what they are doing in the app is crucial for all other areas of app marketing.”
For this, you need to do thorough market research. Using surveys, questionnaires, and focus group discussions will allow you to extract insights about your ideal users.

Source: DECODE
All of this information is crucial for the next step: defining the user funnel. This is the series of actions people take, from discovering your app to using it. It will look something like this.
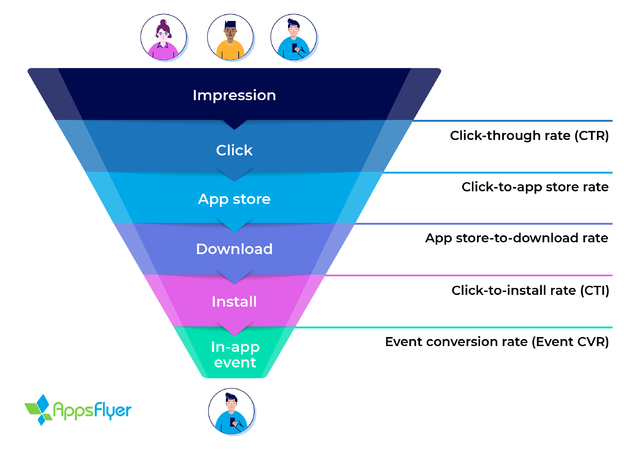
Source: Apps Flyer
Once you’ve defined your funnel, you can use key metrics to measure the performance of each step. From here, you’ll know exactly what’s causing users to drop off and, more importantly, how to fix it.
For example, you can check the effectiveness of your app store optimization (ASO) efforts through your app store page’s download rate.
If it’s low, you might need to work on your description or solicit more reviews.
But if it’s your app store visit metric that’s low, then you might have a visibility problem. Focusing on keyword optimization or paid search ads might do the trick.
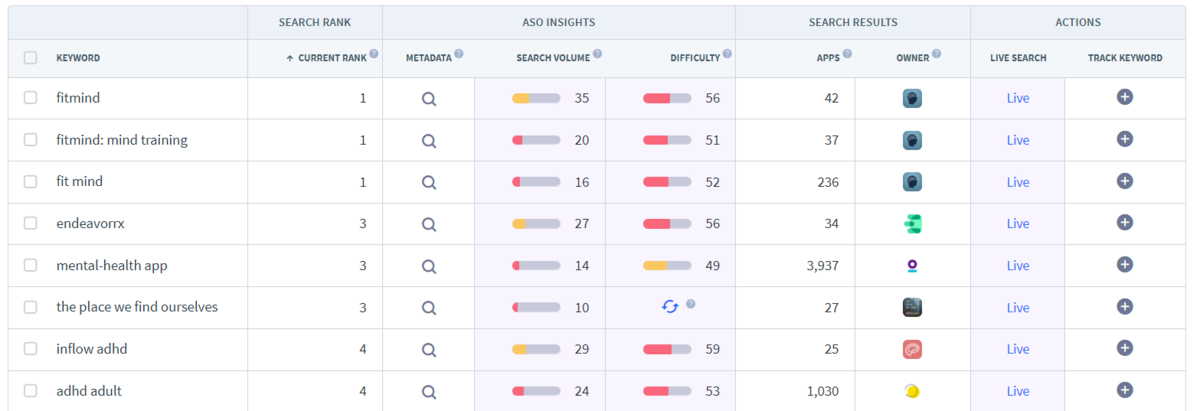
Source: App Radar
This ability to pinpoint where the issues are and fix them can dramatically improve the viability of your app. In the end, that’s what analytics is all about.
But you can only do it by understanding the user’s journey.
On its own, app metrics can help you optimize issues like low retention or high crash rates. But you can glean more insights from that data by comparing it with the wider industry.
For one, it can tell you which targets to aim for. This can make your goals much more realistic.
For example, the average 90-day retention rate of apps in 2021 was around 20%-30%, according to AppsFlyer and Mixpanel.
So, if you’re a banking app and your retention rate is 35%, you might feel you’re exceeding expectations.
However, retention rates vary by app category:
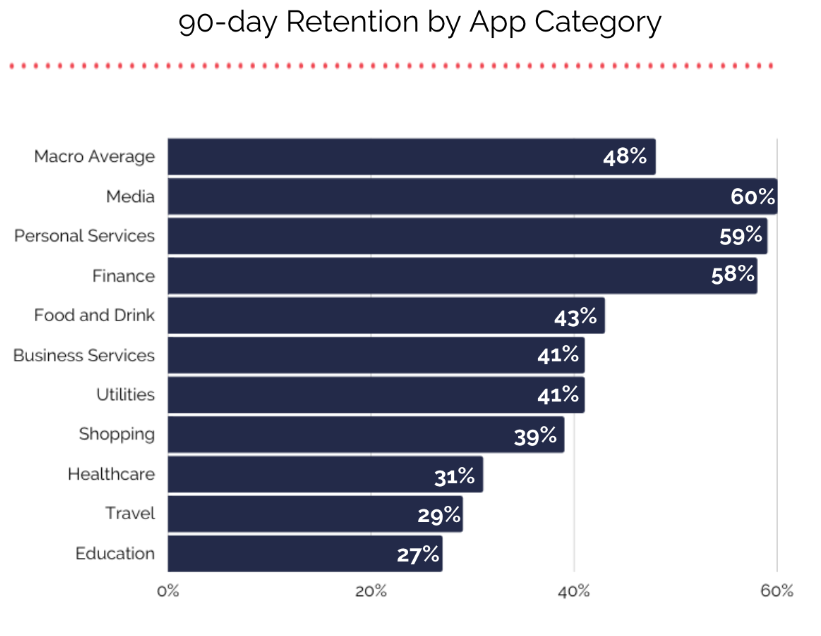
Source: Business2Community
Suddenly, your 35% retention rate seems low compared to the average of 58% for finance apps.
When benchmarking, it’s best to keep in mind both your closest competitors and the top players in your industry.
The former will most likely have the biggest impact on your user base and warrant close monitoring. The latter, on the other hand, is best for long-term positioning.
You should also benchmark yourself against trends and seasons to account for unusual spikes in your metric.
For example, you might think your fitness app is doing better than usual because of the bump-up in installs. But trends might tell you that January is usually where such apps do well.
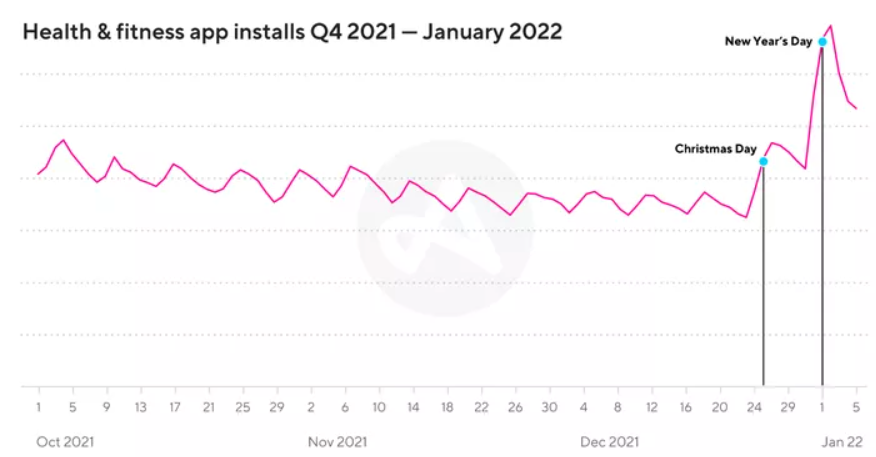
Source: Adjust
Lastly, pick only the metrics that you can compare yourself against reasonably.
For example, comparing app store optimization metrics with a competitor who puts no effort into optimization is not worth your while.
People often say not to compare yourself against your competitors, but comparison does have its place in business. Just don’t make it the sole factor when making decisions.
Your analytics will be only as good as your collection method. That’s why picking the right tool for the job is essential.
The most important consideration here is that the tool should support the metric you’re trying to measure.
Most platforms don’t usually cover every metric. Some are more specialized in certain aspects, like how UXCam focuses on UX analysis through recordings of user sessions.
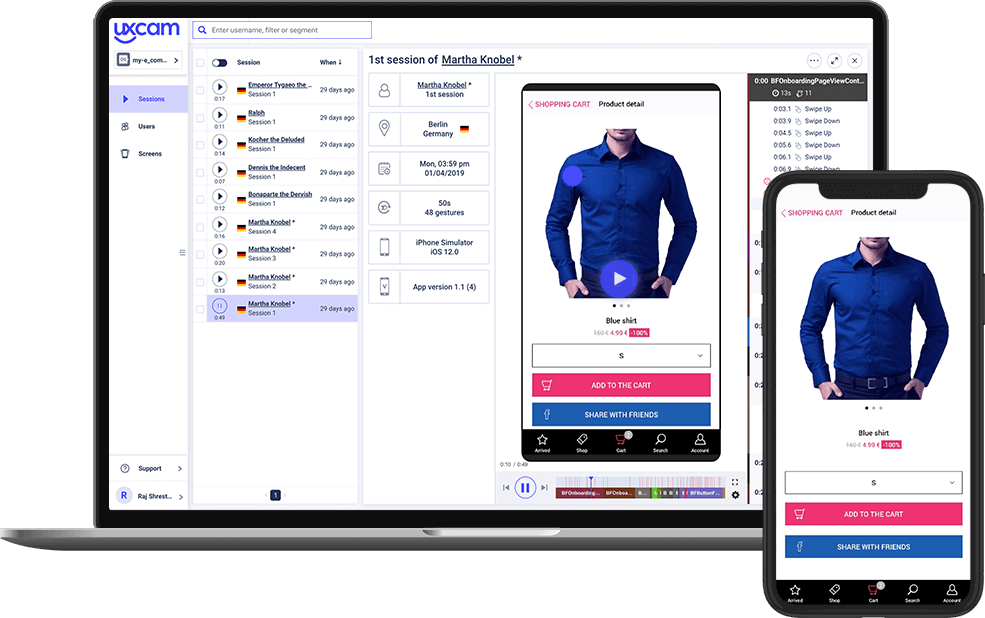
Source: DECODE
That’s why planning for your analytics approach should be done early. It helps you know which metrics matter to you and thus narrow down the solutions you’ll need.
Fortunately, there’s no shortage of app analytics tools you can consider.
One of these is Firebase, Google’s app maintenance platform.
Like its cousin Google Analytics, Firebase offers a robust all-in-one solution that covers most key app metrics. It also supports various test methods like A/B tests.
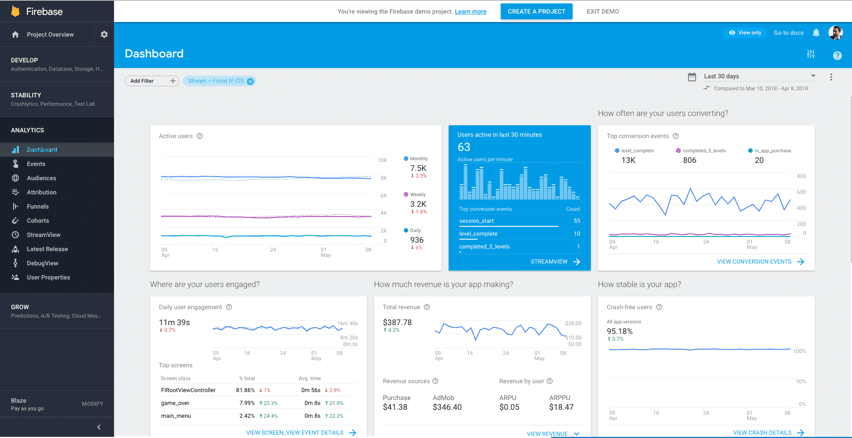
Source: Analytics Canvas
Mixpanel is another good option that’s geared more towards larger apps. It has unique reports like the Addiction Report for measuring your app’s retention rate.
It also has a funnel analysis perfect for optimizing many aspects of your app.
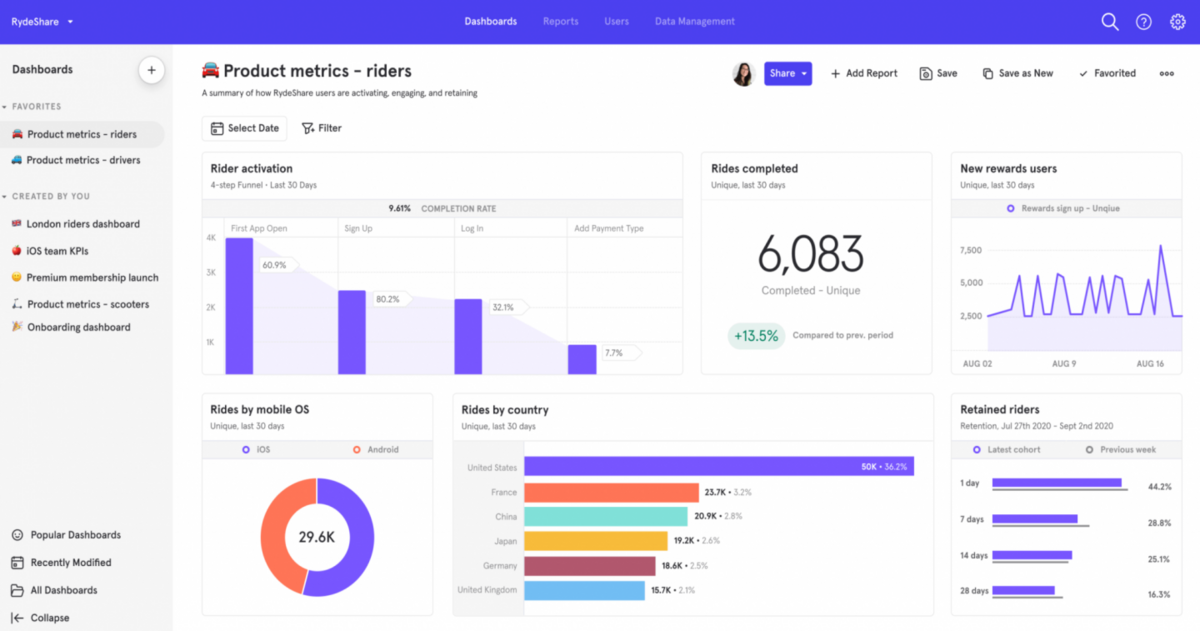
Source: DECODE
Many of these tools have free pricing schemes so you can try them out first.
But if budget is an issue, you can always try free tools like Apple’s native App Analytics platform for iOS.
It’s one of the easiest ways to measure your app store performance that other analytics platforms might not offer.
It also provides metrics on retention, engagement, and in-app events, but they’re generally subpar compared to other paid options.
Nevertheless, the fact that it’s free and requires no setup makes it a good addition to your analytics toolkit.
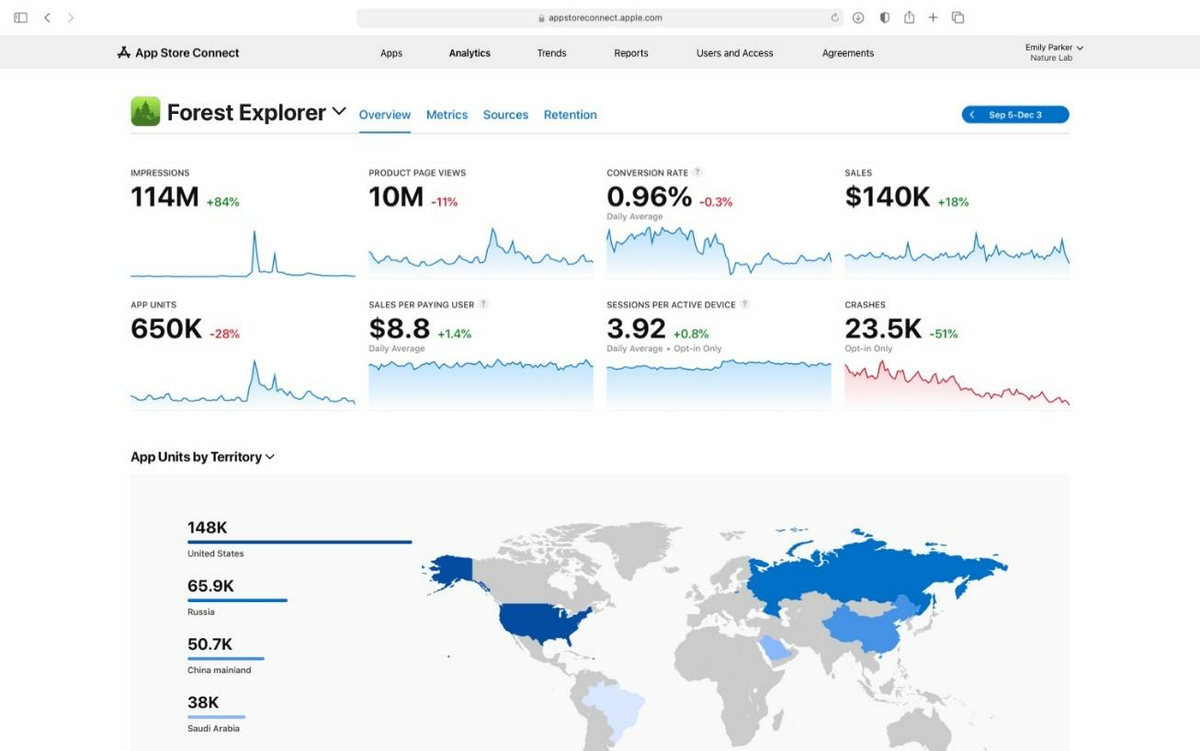
Source: Apple
Finally, there’s Shake. It’s a unique analytics tool because it involves the users directly. They can send feedback, report bugs, and even ask questions.
The qualitative data provided by the app complements the insights you get from other analytics platforms.

Source: DECODE
There are dozens of other great analytics tools that can’t be covered in this short section. To learn more, check our coverage on the 13 top app analytics tools.
There you have it—five best practices you can apply to improve your analytics game. We hope this will lead you to better insights and feedback for your app.
But it shouldn’t stop there. Analytics is constantly evolving, with new tools and methodologies to consider.
As it’s your primary optimization tool, you should always strive to gather the best data.
That’s the secret to app success.

Marko started DECODE with co-founders Peter and Mario, and a decade later, leads the company as CEO. His role is now almost entirely centred around business strategy, though his extensive background in software engineering makes sure he sees the future of the company from every angle. A graduate of the University of Zagreb’s Faculty of Electrical Engineering and Computing, he’s fascinated by the architecture of mobile apps and reactive programming, and a strong believer in life-long learning. Always ready for action. Or an impromptu skiing trip.
This guide will help you learn everything you need to know about mobile app analytics, including methods and best practices.

We give you some great strategies and tips on how to increase the number of positive reviews on your app page.

No doubt, analytics tools are an integral component of any successful mobile app marketing strategy today. Check our recommended 13 mobile app analytics tools.