
How to hire a mobile app agency
We cover the best practices and approaches to consider once you decide to hire a mobile app agency and making the most of the partnership.
You can’t improve what you can’t track. That’s as true in life as it is in mobile app development.
Without proper tracking, you wouldn’t know how well your app performs or if it’s profitable, which could lead to unwise decisions that hurt your bottom line.
That’s where app metrics come in.
They are objective measures of the specific aspects of your app, such as loading time and crash rate.
But with dozens of metrics you can measure, how do you know which ones truly matter?
Here are some that deserve a closer look.
The primary set of metrics you should track is app performance.
After all, if your app loads slowly or is not visible in the app store, none of the other metrics matter.
App store optimization (ASO) implies improving your app’s visibility and discoverability in the app store to increase organic downloads and installs.
In many ways, ASO is search engine optimization (SEO) aimed specifically at Google Play and Apple’s App Store. That’s because, at its core, they are nothing more than search engines but for apps instead of web pages.
Get your free copy and find out how successful entrepreneurs define parameters of success!
ASO involves many metrics, depending on what your priority is. However, for most app developers or app owners, the most important ones are those that measure visibility and conversions.
Visibility ensures that your target users find your app in search results.The crucial metrics here are Keyword and App Category Ranking.
Does your app appear on top of the store results when users search for relevant keywords?
Does your app rank well in its app category (e.g. games, productivity, etc.)?
These tell you where your app ranks for keyword search results or app categories (like games, productivity, etc.), respectively.
You then use that data for keyword research or with tools like AppTweak to improve rankings.
Conversions refer to how many people installed your app after finding it in search results, measured with the Conversion Rate (CR) metric.
It tells you how effective your app page, icon, or name is at attracting users to download your app.
To calculate CR, divide the number of app installs by the number of users who visited your app page.
CR is a vital benchmark to tweak your app product page, name, or icon to help drive more downloads.
You can use A/B testing tools like Splitmetrics to experiment with various prototypes to see which increases your CR the most.
ASO is a vast subject with lots of nuances to take into account. If you’d like to know more, check out our excellent ASO guide.
App load time measures how long your app opens when users tap on it on their home screen.
It’s one of the fundamental metrics of app performance that significantly impacts your user experience.
A disappointed user might even leave a negative review on your app page, which can hamper your future conversion rates as well.
Monitoring and optimizing your load time should therefore be at the top of your app maintenance list.
According to a study by AppDynamics, more than 85% of US users have uninstalled an app due to performance issues, including long load times.
A free tool you can use is Google’s Firebase Performance Monitoring, which allows you to collect load times and other performance metrics directly from users.
Aim for load times of 3 seconds or less, as anything longer than that can lead to user abandonment.
If your app has long load times, there are fortunately many ways to fix the problem.
These include compressing images to reduce file sizes, simplifying the app code for faster execution, and updating slow third-party plugins if your app uses any.
But even with a fast load time, you might find that your app is still sluggish. That’s because there’s another factor at play that determines your app’s overall speed – latency.
When your app requests data to a server or database, there is always a slight delay. This is called app latency and is distinct from app load time.
You can think of app load time as an offline delay, while latency is an online one.
Like load time, you can measure app latency with Firebase Performance Monitoring. Aim for a latency of 1 second or less for the best user experience.
Unfortunately, app latency is unavoidable due to the nature of computer networks. So your goal is to lower this delay as much as you can.
Compared to load times, latency is trickier to fix because it involves infrastructure that’s often beyond your control.

You can, however, improve the situation by using content delivery networks (CDN). CDNs store your data in servers geographically closer to your end-users, so it gets to their apps faster.
Often, though, the way to tackle app latency issues is to ethically “hide” the fact that there’s a delay.
You can do this by using progress bars with valuable content to keep users engaged or dynamically loading app pages as needed to reduce load.
The main takeaway is to optimize both loading time and latency to ensure the fastest app performance.
App stability is an essential measure of performance and engagement because it ensures that people can continue using your app without any disruption. When these disruptions do happen, in the form of glitches or errors, a crash occurs.
How often this happens is called the crash rate.
Crashes are not only frustrating for users but also reflect poorly on the app developer. Lowering your crash rate is one of the more effective ways to increase your mobile app rating.
Measuring your crash rate is therefore vital for your app’s overall health. Luckily, both the App Store and Google Play provide detailed crash reports you can consult.
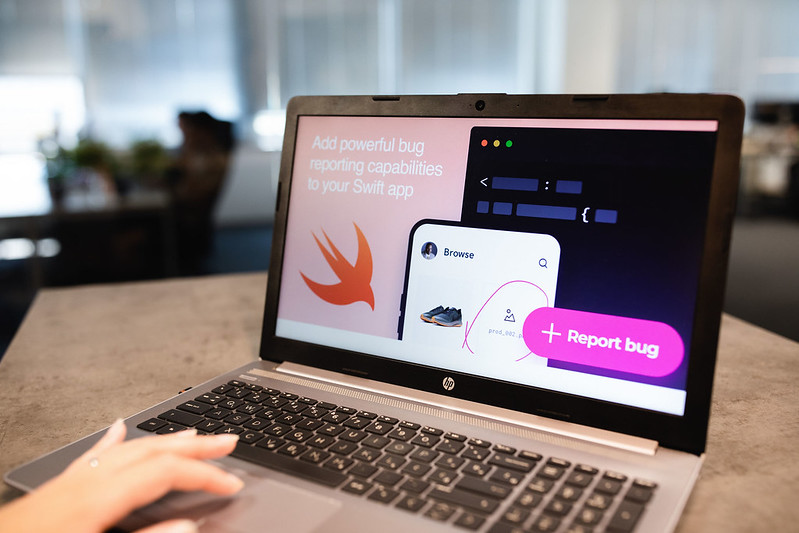
Another popular tool for measuring the crash rate is Shake. To add bug reporting capabilities to your app, please follow these instructions.
It’s important to know that it’s near impossible to have zero crashes, so your strategy is to keep it at a minimum.
As per Qualitrix, the acceptable ranges should be:
While no developer likes to receive crash reports, they are necessary for fine-tuning your app. They can tell you of errors you might have missed and need to handle on your next update.
Crashes can be beneficial. The key is to address them as fast as you can.
Apps are businesses, so they need to make money. And an app’s profitability is tied to its users’ cost and value, measured with user acquisition metrics.
Customer Acquisition Cost (CAC) measures how much you spend on average to get someone to use your app.
Combined with other acquisition metrics like CLTV (which we’ll discuss next), CAC can tell you a lot about your app’s overall financial performance.
The lower your CAC, the more profitable your app can be.The basic CAC formula is to divide your app marketing cost by the total number of users you gained over a set period.
App marketing cost / total number of users
There are, however, many ways to calculate CAC depending on your app business model.
For instance, you can calculate paying and free users separately, which is the better approach for freemium apps.
You can also consider other costs like development, maintenance, and admin to give you a more comprehensive CAC.
The key to lowering CAC is to increase the number of users you attract while reducing and maximizing your marketing spend.
Long-term strategies include having a referral program, optimizing your app store conversion rate, or delivering an excellent user experience.
While CAC can bring valuable insights on its own, it needs the context that other user acquisition metrics bring to paint a much clearer financial picture. One of the most crucial is CLTV.
Customer Lifetime Value (CLTV) measures how much revenue a user brings over the entire lifetime that they’re using your app.
Here’s how to calculate it, according to Alex Walz at Apptentive:
ARPU x (1 / Churn Rate) + Referral Value
On the other hand, CLTV describes your app’s income, which is the exact opposite of CAC. Since each deals with two aspects of your app’s financial health, they’re powerful when combined.
The CAC/CLTV ratio tells you precisely how profitable your app is and what your next marketing move should be.
If CLTV is less than or equal to CAC, you’re losing money on your app and need to work on either lowering CAC or increasing CLTV.

If CLTV is greater than CAC (ideally at a 3:1 ratio), it means your app is profitable. You can continue with your marketing strategy or invest in other campaigns like paid ads to expand your user base.
There are many ways to improve CLTV, such as improving engagement with regular content or encouraging referrals with an affiliate program.
However, the most straightforward route is to increase your app monetization, measured through ARPU and ARPPU.
ARPU and ARPPU are key metrics that measure app monetization or how well you’re converting user engagement into revenue. Still, what’s the difference between the two, and when do you use one over the other?
ARPU (Average Revenue Per User) is the average earnings you get per user. To calculate, you divide your total revenue by the number of active users over a given time (or Revenue / Users).
ARPU: total revenue / number of active users
ARPPU: total revenue / number of active paying users
ARPU is useful if you want an overview of your overall monetization strategy.
However, ARPU doesn’t differentiate between paid and free users, which is where ARPPU comes in.
ARPPU (Average Revenue Per Paying User) uses the same formula as ARPU but only takes paying users into account. It’s the more accurate metric for apps with revenue that comes from only a small number of users, such as freemium games.
To increase your ARPU and ARPPU, you must improve your app monetization strategy. You can do this by encouraging more in-app purchases through pricing bundles or new premium content.
If you rely on ad revenue, you can try reward video ads, which areup to 7.5X more effective and cost 86% less than conventional video ads.
As with other user acquisition metrics, ARPU and ARPPU aren’t meant to be analyzed in isolation. After all, having exceptional ARPU is useless if you have a higher CAC.
Optimizing all three metrics (CAC, CLTV, ARPU/ARPPU) is the key to making a profitable app.
User engagement is the foundation for app success because an app will never be profitable if people don’t want to use it.
The metrics in this group allow you to track user engagement and pinpoint areas where you can improve.
Daily Active Users (DAU) and Monthly Active Users (MAU) measure how many users opened and used your app for a set period.
They are better measures of engagement and popularity than vanity metrics like app installs because they consider how many active users there are.
You can easily track DAU and MAU with tools like Google Firebase Monitoring, UXCam, and Mixpanel. Whether you use DAU or MAU depends on your app’s nature and the behavior of your users.
DAU is best for apps that rely on daily interaction. Examples include news, fitness, and social media apps. Apps that are used less frequently or only in specific situations are better off with MAU.
You can also combine DAU and MAU to measure “stickiness,” which tells you how many of your monthly users are “power” users that interact with your app daily.
If you want to increase your DAU and MAU, look at your app’s retention strategy.
Examine your onboarding process to make sure users know how to get started or support content, so they don’t get lost in your app.
You can also use push notifications to remind users to use your app regularly.
Despite the insights that DAU and DAU can give you, they are merely an overview of your engagement. You can use other metrics, like Average Session Length, to dive deeper.
Average session length is the time from when the user opens your app until it either goes idle or the user closes it into the background. But why is this important?
How long a user spent using your app is a better indication of its engagement, more than frequency metrics like DAU and MAU. After all, people won’t stay with your app if they don’t find it helpful, educational, or entertaining.
A long session length isn’t a desirable goal for all apps.
A person using Uber, for example, needs to do it as quickly as possible. A long session length here might indicate a problem with app performance or usability.
Your approach to improving your average session length should then depend if you want to lengthen or shorten it.
To promote longer sessions, work on adding engaging content or features to keep users hooked.
If you wish to shorten sessions, make the user interface as efficient and usable as possible.
Once you’ve optimized Average Session Length, the next step is to keep them coming back. That’s where Retention Rate comes in.
Retention rate measures the percentage of people that use your app regularly over a set period. You calculate it by dividing the number of active users by the number of installs over a set period.
Tracking your retention rate is a more accurate way to measure just how engaging your app is, compared to app installs.
Number of active users / number of app installs
That’s because it’s relatively easy to get users to download your app (especially if it’s free) but harder to keep them engaged enough to become loyal, paying users eventually.
Industry benchmarks illustrate this point nicely. The average 30-day retention rate of mobile apps is at 43% but drops drastically to 29% after 90 days. Note that these figures can vary widely depending on industry and app category.
Based on these statistics, it’s best to aim for retention rates of at least 25%. So what can you do to improve if your rates dip below this range?
As with all metrics in this group, it all comes down to improving engagement and user experience.
Personalization and in-app messaging are great ways to make the user feel more connected with your app and, consequently, use it more frequently. Remarketing is also a subtle approach to get idle users back to your app.
But the more effective way to raise retention is to look at the other side of the coin — why are your users dropping in the first place? That’s something Churn Rate can tell you.
Churn happens when users decide to stop using your app. The percentage of users who do this is called your churn rate.
Calculating your churn rate is straightforward.
Take the number of users you had at the beginning of a set timeframe (say, a month) and subtract the number of users you had at the end.
This tells you how many users dropped during that time.
You then divide the number of people who dropped by the total number of users you had at the beginning of the period to get your churn rate.

However, there’s an easier way to get your churn rate if you know your retention rate — simply subtract it from 100%.
In other words, if you have a 25% retention rate, your churn rate is 75%.
Lowering your churn rate and optimizing your retention rate is crucial to growing your app profitably. That’s because it’s more expensive to acquire a new customer than it is to keep them.
The strategy to improve your retention rate also applies to churn; they’re opposites, after all.
If you’re struggling to find out where to start, getting user feedback is key. That’s what the next group of metrics is for.
Direct feedback from your users is some of the most valuable insights you can get to fine-tune your app.
That’s why regularly monitoring customer satisfaction metrics should be a vital part of your app analytics.
Ratings and reviews are crucial factors that affect most consumer decisions online, from buying in e-commerce stores to joining a membership site. The same is true with mobile apps.
Users now look at ratings and reviews more than ever to decide whether to download an app.
Research shows that more than 90% of consumers are willing to download a 4 or 5-star app, but only 50% for 3-star apps.
That means improving an app’s rating from 3 to 4 stars results in an 89% jump in conversion rates.
These metrics are very effective because they constitute some of the best forms of social proof.
App ratings and reviews show you how satisfied users are with your app since people will only ever leave a review if they’re either thrilled or have a critical issue to complain about.
Improving your ratings and reviews is a core part of an app marketing strategy —which relies on you delivering an excellent app experience.
However, you may find yourself simply not getting enough reviews from users.
To remedy this, you can simply ask users to leave a rating or review in your app to help drive your ratings up (assuming the app experience you deliver is as flawless as it should be).
Reviews, however, are not your only source of insights from your customers. You can also ask them for feedback directly in your app.
In-app feedback is any method of collecting satisfaction insights inside your app.
The best way to collect these valuable insights is by using a handy tool like Shake.
There are plenty of benefits with this method than app reviews, but the top one is accuracy.
Since users are in the middle of using your app when they send the feedback, it’s a better gauge of their satisfaction level at the time.
People are also more willing to give in-app input since it’s more convenient than leaving a review in the app store.

There are various in-app feedback metrics you can implement.
The most popular is the Net Promoter Score (NPS) because it only involves a simple question – how likely is the user to promote your app to friends and family?
The logic here is that if someone is willing to recommend something, they must be more than happy with it.
Another metric is the Customer Satisfaction Score (CSAT), which measures how happy a user is when interacting with your app.
App users can also use the Customer Effort Score (CES) to rate how effective you are in resolving app issues.
In-app feedback can give you an idea of how satisfied your app users are and how to improve upon that.
Nevertheless, to get a clearer picture, it’s best to combine in-app feedback with other sources of feedback from the app store, email surveys, and even social media.
Lastly, don’t forget to follow up with users who shared their feedback with you. It shows them that you value their opinion, which can increase loyalty and even engagement.
Heatmaps and user recordings are some of the most accurate tools you have for measuring customer satisfaction.
Both are forms of in-app analytics: methods that record user behavior while they use your app. The significant difference between the two is how they achieve this goal.
Heatmaps record user interaction with your app through the use of color overlays. Red areas indicate parts of your screen where users tapped or scrolled the most, while blue records areas with low engagement.

User recordings, on the other hand, are much more direct. They’re screen recordings of your app while a person uses it, therefore capturing every action they do.
Heatmaps and user recordings are useful for giving you precise insights into how users engage with your app. You’ll discover which features they like the most, how easily they can move from screen to screen, and if there are problem areas with your user interface.
Using this valuable data, you know precisely which parts of your app to retain or change.
You can also use heatmaps or user recordings with A/B testing tools to experiment with different app interface variations to see which one performs better.
The bottom line is that heatmaps and user recordings can give you unique insights, allowing you to detect problems that are otherwise challenging to spot.
Going from app startup to the next big hit is a challenging journey, especially in today’s crowded marketplace.
Metrics, fortunately, can help bridge that gap.
As long as you track the metrics that matter and address them properly, there’s no reason you won’t achieve success with your app.
Want to get started measuring the essential metrics? Check out our list of the 13 app analytics tools you can use right now.

An Applied Sciences graduate and a true connoisseur of tech, Ivan is a software developer with a genuine love for exploring new technologies. QAs love his code, and his fellow developers always value his input. For Ivan, there is no issue too small to talk over, and no problem that can’t be solved together. When he is not coding, Ivan is usually hiking or playing football. His ideal workspace? Probably a cottage in the mountains, with a serious gaming setup and fast internet connection.
We cover the best practices and approaches to consider once you decide to hire a mobile app agency and making the most of the partnership.

We’ve covered some of the biggest and most exciting trends in the FinTech world.
In this article, we'll share 11 common reasons why app crashing happens and walk you through some tips and tools for avoiding them.