Shipping software quickly is easy. Shipping software that stays fast, stable, and scalable is not.
Most teams already track data like velocity, story points, or commits, but few measure what truly reflects performance.
The answer is to track KPIs that tell the full story.
The right metrics show you how efficiently you deliver, how reliable your releases are, and how healthy your codebase is.
And they make it clear where you should focus, what to improve, and when to adapt.
In this article, we’ll take a look at 15 top KPIs you should consider tracking. You’ll learn what each metric means, why it matters, and how to use it.
How to choose the right KPIs for your development team
Start with your goals and what you want to achieve.
Is it faster delivery, fewer bugs, or better collaboration? Your KPIs should connect directly to those goals.
Next, look at your team’s current stage.
A new team needs different metrics than a mature one. If a metric won’t change how you work, it’s not worth tracking.
Here’s a simple way to think about it:
Early-stage teams – Focus on basics like lead time, deployment frequency, and sprint completion rates.
Mid-stage teams – Track code quality, technical debt, and collaboration efficiency.
Elite teams – Connect engineering output to business impact through customer-centric metrics.
The DORA framework helps you benchmark progress across four tiers — low, medium, high, and elite — using metrics like deployment frequency, change failure rate, and mean time to recovery.
Start by comparing against your own history, then use industry data for context.
Also, avoid vanity metrics. Lines of code or individual productivity scores tell you nothing about value and can create competition instead of collaboration.
Focus on team outcomes:
Code quality: coverage, churn, technical debt
Team velocity: completed story points or throughput
Collaboration: pull request patterns and review times
You also need a mix of leading and lagging indicators.
Leading indicators (like cycle time or WIP limits) show early warning signs, while lagging indicators (like defect density or deployment frequency) confirm results.
Pair them to get a complete picture. For example, track cycle time (leading) with deployment frequency (lagging), or code churn (leading) with defect density (lagging).
But, too many metrics create noise, so you should keep your core KPI set focused. 5 to 7 metrics is the sweet spot.
The best KPIs are the ones your team actually uses to make decisions. If a metric doesn’t drive action or start a discussion, drop it.
Development velocity and flow metrics
Flow metrics show how your team moves work through the development process. They pinpoint bottlenecks, expose inefficiencies, and highlight where you can speed up delivery.
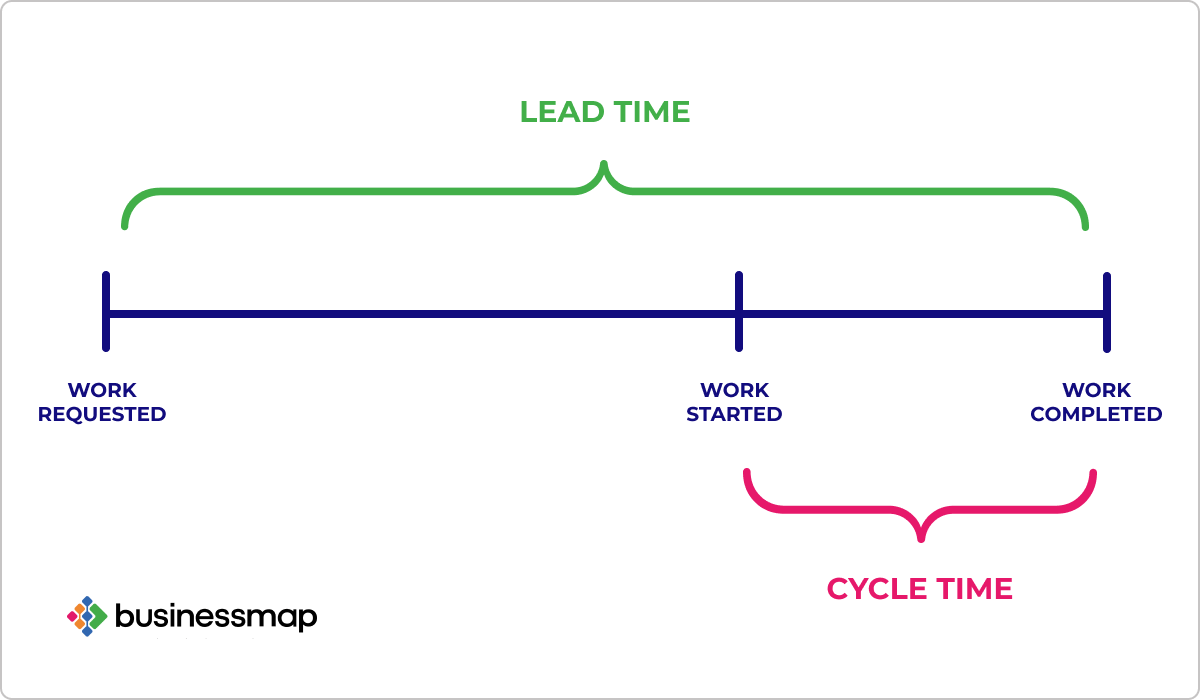
Cycle time
Cycle time measures how long it takes to finish a piece of work once it starts. It’s one of the clearest signals of how efficiently your team delivers.
Elite teams complete work in a few days.
Most teams average around a week. If your cycle time stretches beyond two weeks, something in your process needs attention.
Longer cycle times usually point to specific problems: large batches of work, excessive handoffs, slow code reviews, or insufficient test automation.
Track cycle time in each stage: development, review, and testing. This helps you see where work slows down most.
Reducing cycle time isn’t about rushing your team or hitting an arbitrary deadline.
The goal is removing delays and breaking work into smaller, more manageable pieces. Teams that do this get (and act on) feedback faster and face fewer integration issues.
Lead time
Lead time measures the full path from the first request to delivered feature.
It includes cycle time and all waiting time before work begins. This metric shows how quickly your team responds to business and customer needs.
According to the 2024 DORA report, elite teams’ lead time is under a day. High performers take up to a week, while low performers can take months.
The gap comes from process maturity, automation, and backlog management.
Long lead times often come from unclear priorities or slow decision-making. Sometimes work sits idle while teams wait for approvals or dependencies. Other times, projects grow too big before development even starts.
You can shorten lead time by:
Breaking work into smaller batches
Keeping your backlog clean
Reducing dependencies between teams
Version control tools like GitHub or GitLab support this process.
Use them to automate steps and keep delivery moving smoothly.
Development velocity
Development velocity measures how much work your team completes in a sprint.
It’s usually tracked in story points or a similar unit that fits your workflow. The goal is to help you understand your team’s capacity and forecast future performance.
Velocity naturally changes with team size, work complexity, and the kind of product you’re building. Your team’s number might be 30 points per sprint or 60. What really matters is the trend.
Keep velocity steady by focusing on:
Clear and well-scoped work items
Regular sprint reviews to adjust workload
Collaboration between engineering and product teams
Strong test coverage and automation
Use velocity to guide planning, not to grade performance. When teams feel pressure to hit targets, the numbers stop reflecting reality.
Track velocity alongside quality metrics.
If faster delivery leads to more bugs or growing technical debt, slow down and fix the foundation first.
Sustainable velocity means building at a pace your team can maintain and feeling confident about what you ship.
Work-in-progress (WIP) limits
WIP limits control how many tasks your team works on at the same time. This simple habit has a big impact on your team’s focus and flow.
Set clear limits for each stage of your workflow.
For example, cap work in development at eight items and work in review at five. The right number depends on your team’s size and the complexity of their tasks.
Here’s what a WIP limit looks like on a typical Kanban board:
Always include blocked or waiting work in your count. That creates healthy pressure to solve problems quickly instead of letting them pile up.
When defining your limits, keep in mind:
Most software teams stay within 8 to 12 stories in progress
Complex or testing-heavy work benefits from lower limits
Each item should have clear ownership so nothing stalls between stages
Review your limits regularly. As your processes evolve or your team grows, the right balance may change.
You want to achieve a steady, sustainable flow of work that keeps your team focused without constant context switching.
Code quality metrics
Quality metrics tell you whether you’re building software that’s maintainable, reliable, and safe to change. And they’re leading indicators of future problems.
Code coverage
Code coverage measures how much of your code runs when you execute your automated tests.
Higher coverage usually points to better testing discipline and fewer undetected bugs.
Safety-critical systems often target 90%+ coverage, sometimes with regulatory requirements for specific coverage types.
Don’t chase 100% coverage. Some code is hard or meaningless to test. Filling your suite with trivial tests to hit a target wastes time and gives a false sense of safety.
Focus on meaningful coverage instead.
Test critical paths, complex logic, boundary conditions, and code that changes frequently. Use coverage as one quality signal among several, not as a standalone target.
Combine code coverage with other quality indicators like defect density to get the full picture.
Code churn rate
Code churn measures how much of your code changes over time.
It’s usually calculated by dividing the number of lines added, modified, or deleted by the total lines of code, then expressing that as a percentage.
On its own, churn is not good or bad. It shows how active your codebase is and where work tends to concentrate.
What matters is the context and timing. Here are the typical benchmarks for code churn:
Below 15% often signals a stable or highly efficient team
15–25% is a healthy range for most teams
Above 25% is a warning sign
High churn is normal in new projects or large refactors.
What’s concerning is sustained high churn after the first release, especially in the same features.
That often points to unclear requirements, poor design decisions, or code that’s difficult to maintain.
Use churn to pinpoint problem areas. Look for files or components that keep changing. Then compare churn with your defect data:
High churn with many defects usually means code quality problems
High churn with few defects often means the team is improving existing code
Low churn with more bugs points to slow improvement and increased technical debt
Your goal shouldn’t be to eliminate churn. That’s impossible, in fact.
Tracking churn helps you see where your codebase needs attention and where your team’s effort actually improves quality.
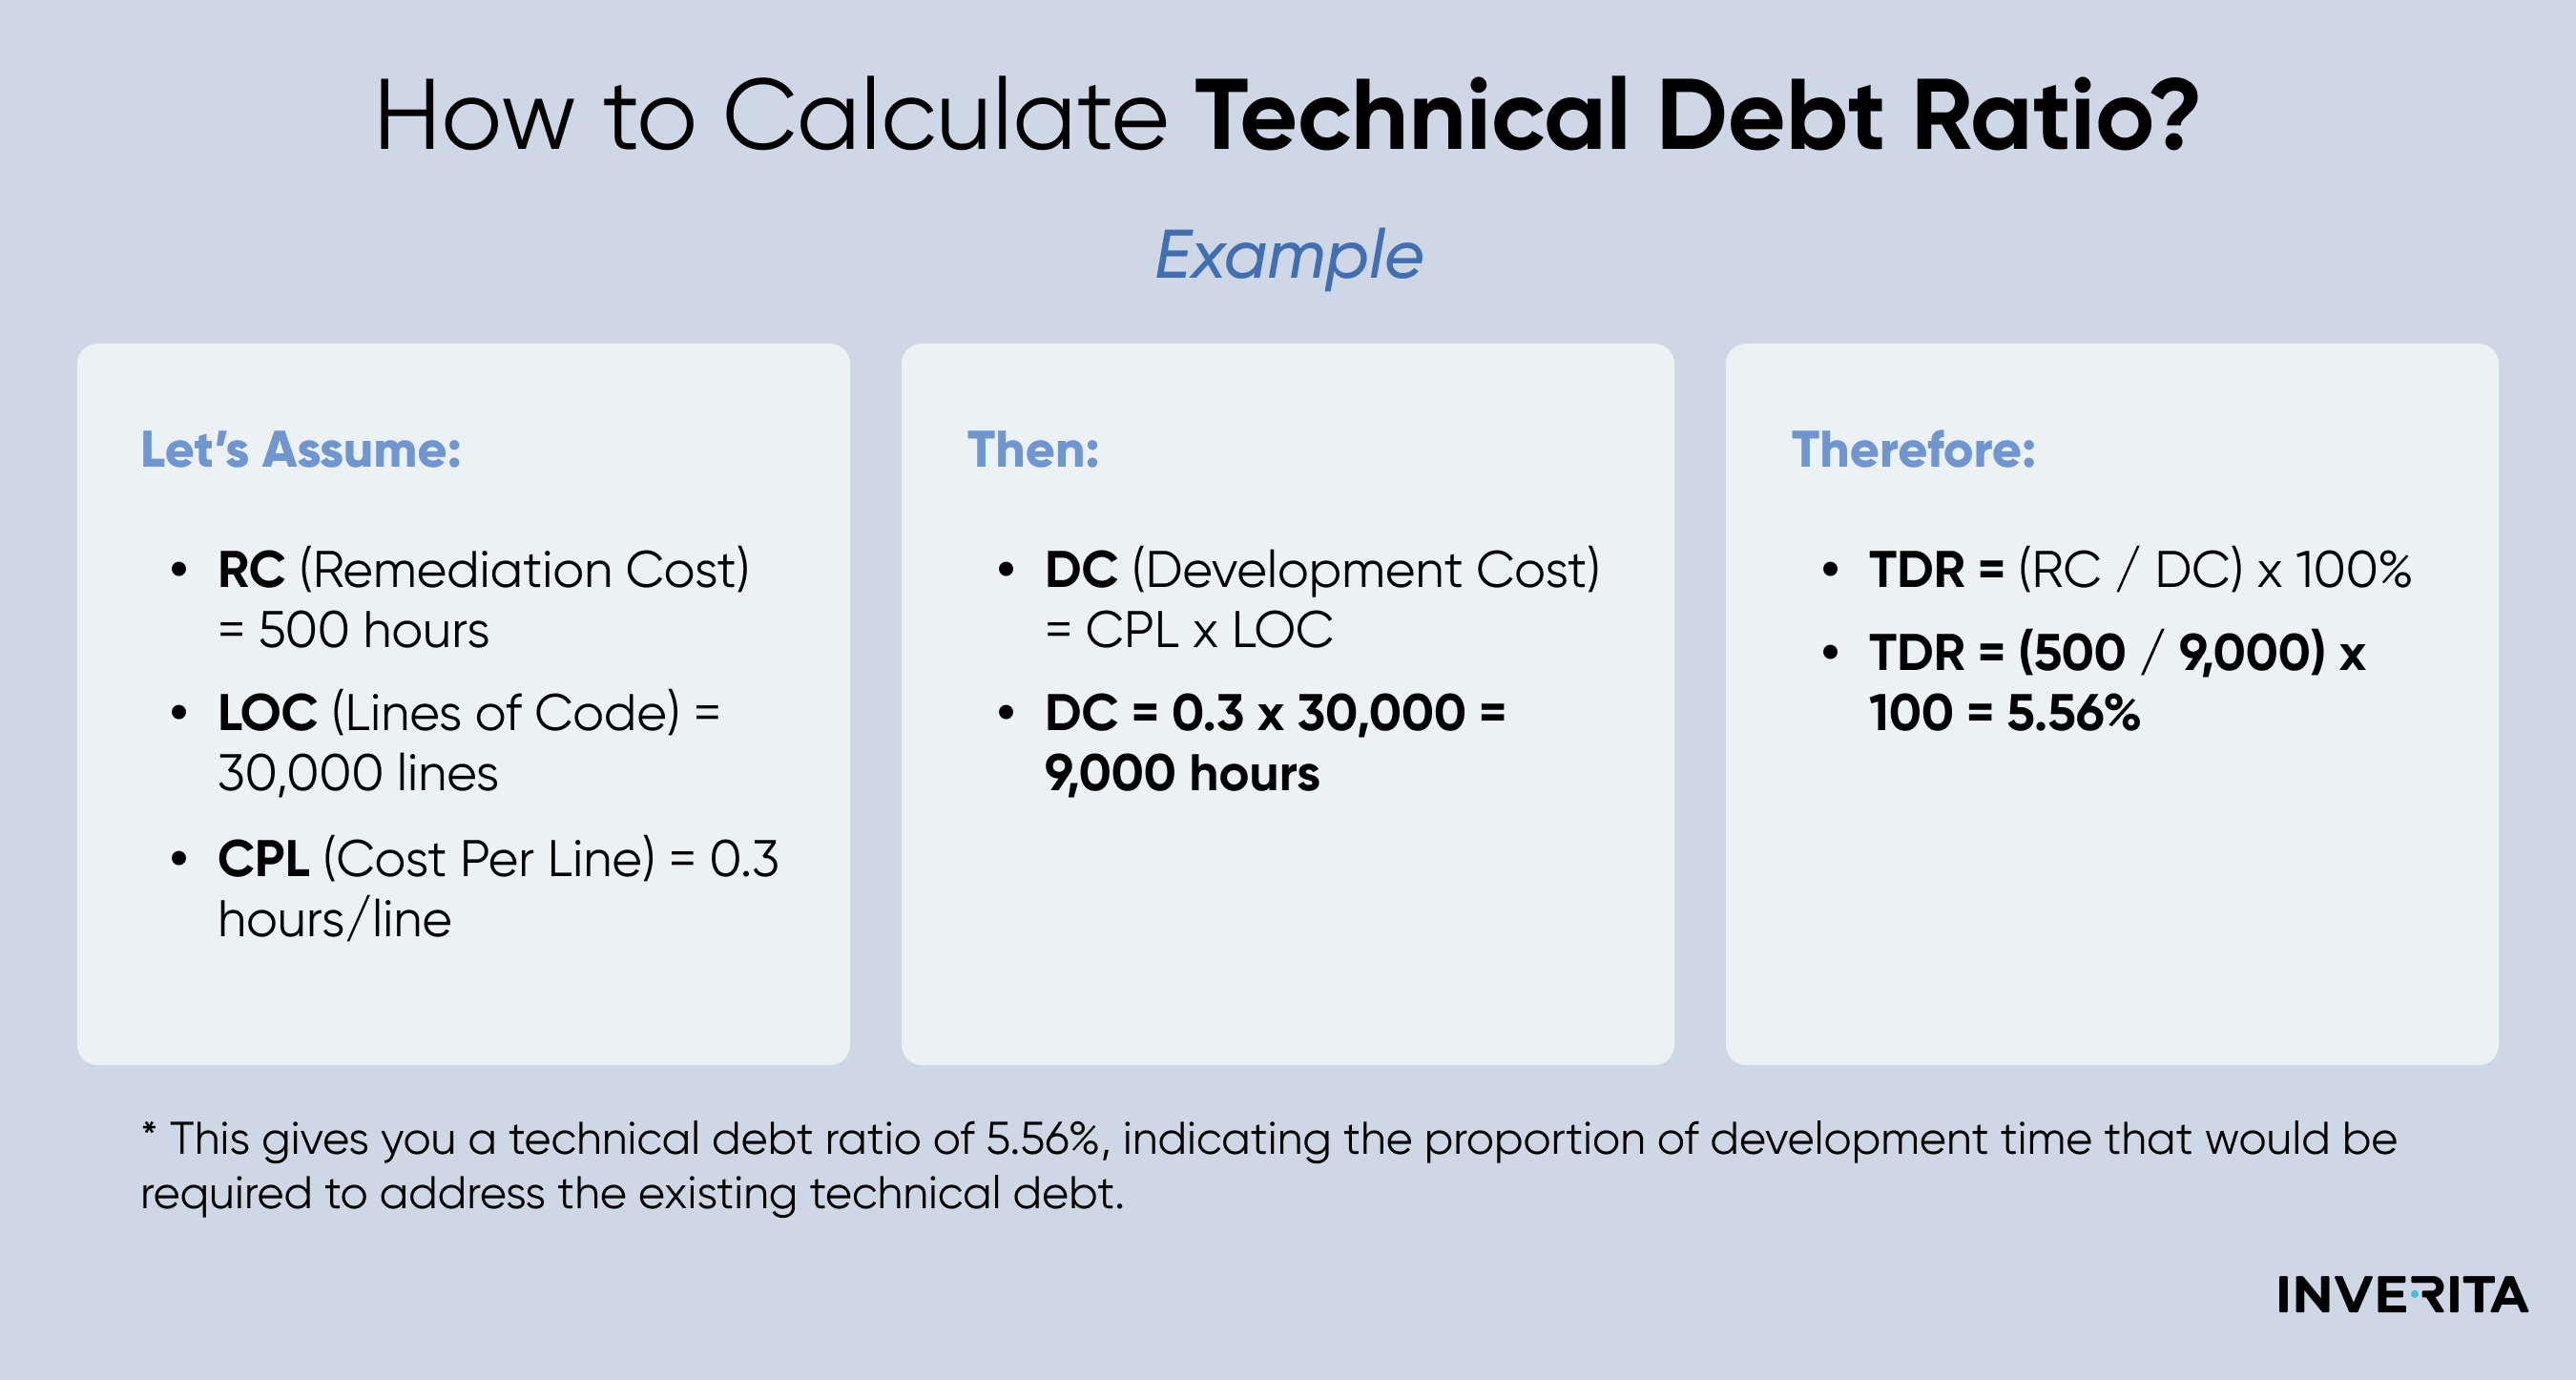
Technical debt ratio
Technical debt ratio (TDR) shows how much effort it would take to fix code issues compared to the effort spent building the product.
It’s calculated as (remediation time ÷ development time) × 100.
There is no single perfect number for every team, but some benchmarks help.
Teams with TDR between 5% and 10% usually maintain strong delivery speed and code quality. Ratios above 20% often signal deeper issues that need attention and planning.
Context matters. Startups building quickly can live with higher ratios for a while. Mature products benefit from keeping debt lower to protect stability and long-term performance.
Technical debt will always exist, but you can choose how to handle it.
Plan cleanup work into your normal sprints. When you treat debt reduction as ongoing maintenance, you keep your codebase healthy and predictable over time.
Defect density
Defect density measures bugs per unit of code, usually expressed as defects per thousand lines of code (KLOC). It’s a straightforward indicator of software quality and reliability.
You calculate defect density by dividing the number of defects by the total lines of code, then multiplying by one thousand.
For example, if you find 50 defects in a 100 KLOC system, your defect density is 0.5.
Targets vary by system type:
Mission-critical systems aim for 0.1 to 0.5 defects per KLOC
Commercial software usually falls between 0.5 and 1.0 during testing, dropping closer to 0.3 by release
Embedded and real-time systems often need rates between 0.05 and 0.2
Trends matter more than any single number.
Track whether your defect density is rising or falling between releases. Connect it to root causes and look for patterns.
Many defects trace back to unclear requirements, design flaws, or frequent changes.
Knowing where they come from helps you fix the right part of your process.
High code coverage tends to lower defect density, but coverage alone is not proof of quality. A low defect count with poor testing just means you haven’t found the bugs yet.
Deployment and reliability metrics (DORA metrics)
These four indicators capture the key dimensions of modern DevOps: speed, stability, and responsiveness.
Deployment frequency
Deployment frequency shows how often your team successfully releases code to production. It’s one of the clearest signs of how quickly you can deliver value.
Higher deployment frequency usually leads to better project outcomes.
Teams that ship often make smaller, safer changes. They catch issues faster and learn from user feedback sooner.
You can increase deployment frequency by:
Automating your testing and release process
Using continuous integration and continuous delivery (CI/CD) pipelines
Managing infrastructure as code to reduce manual steps
Keeping pull requests small and review cycles short
Automation has made frequent deployment the new standard. Most teams now automate a large share of DevOps tasks, which shortens release cycles and lowers risk.
But, speed alone isn’t the goal.
The best teams release often while keeping quality high and change failure rates low.
Lead time for changes
Lead time for changes measures how long it takes for a code commit to reach production.
It’s narrower than total lead time because it focuses only on the time after development starts.
Elite teams consistently stay under one day. High performers average less than a week. Low performers can take months.
The gap usually comes down to automation, pipeline efficiency, and how teams handle approvals and handoffs.
Short lead times let you react quickly to new requirements and bugs. When you can release a fix within hours, you stay close to customer needs and ahead of your competitors.
You can shorten lead time for changes by:
Automating deployment
Removing unnecessary manual approvals
Breaking large features into smaller deployable changes
Improving test reliability
Fast, consistent delivery depends on smooth automation and smart process design. The goal is not just speed but confidence in every release.
Change failure rate
Change failure rate shows how many deployments cause production issues that need immediate fixes.
It’s your best indicator of stability and whether your delivery speed comes at the cost of reliability.
Generally, elite performers maintain change failure rates of 0-15%. High performers fall between 16-30%, while low performers see failure rates of 46-60%:
Lower failure rates don’t just mean fewer outages. They reflect stronger testing, clearer requirements, and disciplined processes.
You can lower your failure rate by:
Improving automated test coverage
Using feature flags to roll out changes safely
Testing in staging environments that match production
Running automated integration tests before every release
Holding post-incident reviews to find and fix root causes
But remember – balance matters.
The goal is not to eliminate all failures but to deploy often and recover quickly when something breaks.
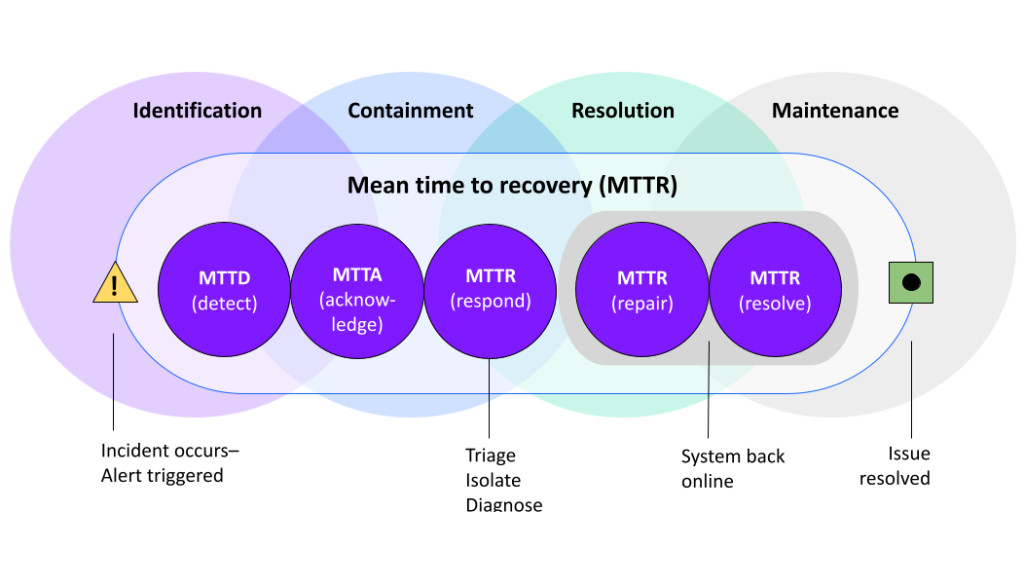
Mean time to recovery (MTTR)
Mean time to recovery measures how long it takes to restore service after a production issue.
It’s a direct look at how resilient your systems are and how effective your incident response process is.
If we look at the 2024 DORA report again: elite teams recover in less than one hour. High performers take less than a day, while low performers need more than six months.
The difference comes from visibility, automation, and how prepared the team is when things go wrong.
Fast recovery limits the impact on customers and keeps your business operations running smoothly. The faster you fix a production issue, the smaller the damage.
You can improve MTTR with real-time monitoring and alerts. Also, enable automated rollback for failed deployments.
And treat every incident as a learning opportunity, not a failure.
Team collaboration and efficiency metrics
Collaboration and efficiency metrics show how effectively your team works together, reveal bottlenecks in your review process, and highlight communication issues.
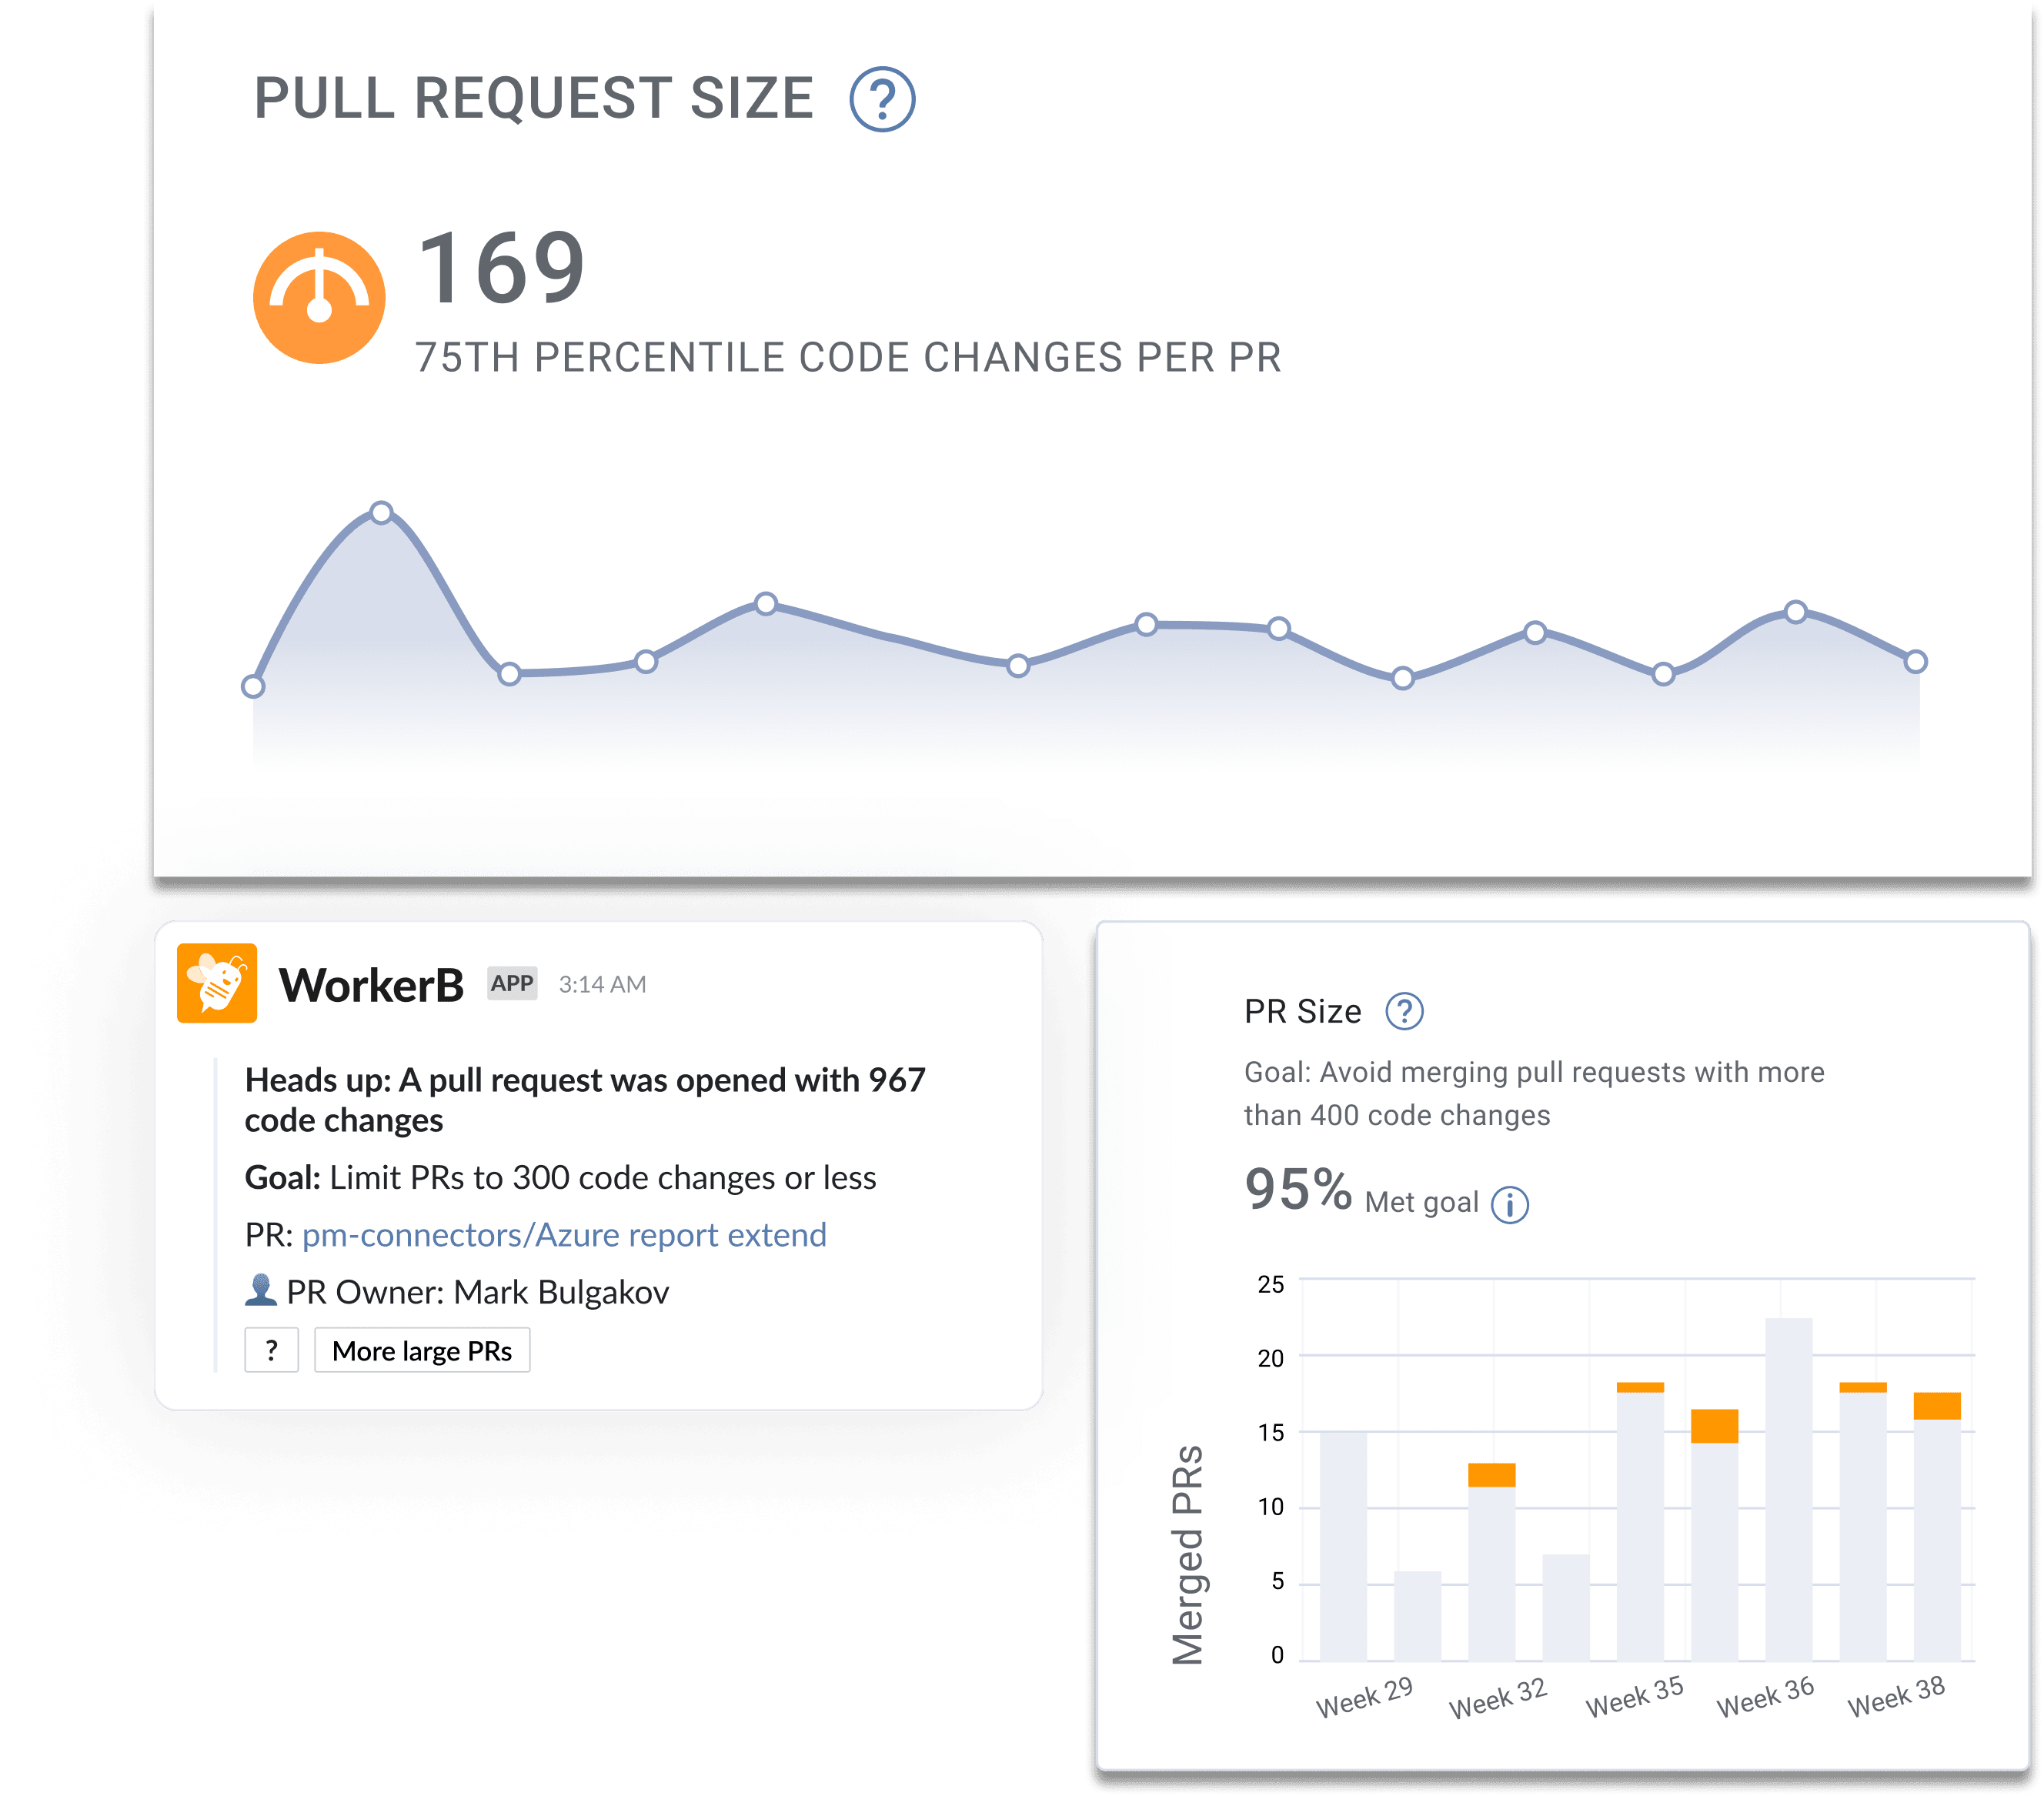
Pull request size
Pull request size has a direct effect on how fast code gets reviewed and how many issues reviewers catch.
Smaller pull requests move through review faster, spot more defects, and merge with fewer problems.
Encourage developers to break work into reviewable chunks and use automated tools to flag oversized PRs.
Review time and pickup time
Review time measures how long a code review takes once it begins. Pickup time tracks how long a pull request waits before someone starts reviewing it.
Together, they reveal how efficiently your team handles code reviews.
You should aim for a median pickup time of around 2 working hours and closing reviews within a day.
Longer pickup times break momentum and frustrate developers. Work sits idle, and context gets lost.
You can shorten both metrics by:
Setting clear expectations for review response times
Rotating a “reviewer on duty” to handle incoming pull requests
Using automated reviewer assignments to spread the load
Tracking pickup and review times separately to find specific bottlenecks
When reviews start quickly and finish on time, your team will deliver faster and with fewer blockers.
Merge frequency and capacity utilization
Merge frequency shows how often code changes get integrated into the main branch.
High merge frequency keeps development moving smoothly and prevents integration conflicts down the line.
Elite teams merge several times a day per developer. A good benchmark for most teams is at least one mainline merge per working day.
Infrequent merges slow delivery and increase the risk of merge conflicts. Branches that stay open too long drift away from the main branch and become harder to integrate.
You can improve this by:
Breaking work into smaller, independent changes
Using feature flags to merge incomplete features safely
Adopting trunk-based development to keep branches short-lived
Capacity utilization measures how much of your team’s available time is planned for active work.
But, trying to plan for 100% utilization will backfire – your team will lose flexibility and quality will suffer.
Plan for around 70–80% of total capacity, to leave space for meetings, unplanned issues, and improvement work.
A little slack will keep your team’s pace sustainable and your team focused on outcomes, not just output.
Software development team metrics: FAQs
A quarterly review works for most teams, while fast-moving teams might do it monthly. The goal is to make sure your metrics still reflect your goals and priorities.
When priorities shift, some KPIs lose relevance. Replace them with metrics that fit your current stage.
A clear sign it is time to adjust is when a metric stops leading to useful conversations or no one acts on it anymore.
Treat KPI reviews like retrospectives for your measurement strategy. Ask what is working, what feels outdated, and what the data is actually telling you.
Keep dashboards simple and easy to read and show trends over time instead of just single data points.
Seeing movement helps everyone understand how their daily work shapes long-term results.
Good dashboards make the context clear. Group related metrics together, such as delivery speed, quality, and stability, so you can easily spot patterns.
Make sure everyone on the team can interpret the data, not just managers.
A clear dashboard helps developers, designers, and product leads make decisions together. Automate updates so the data stays accurate and current.
The best test is simple: ask what you would do if the number changed. If the answer is nothing, remove that metric.
Every KPI should connect to a clear outcome, such as faster delivery, fewer bugs, or happier users.
Metrics should influence how you plan, build, and release. If they only exist to look impressive, they are distractions.
Looking for a reliable software development team?
If you’re looking for a partner who can help you build, scale, and maintain high-quality software, you are in the right place.
We are an EU-based software development company with more than 13+ years of experience working with startups and global enterprises.
Our teams deliver reliable, maintainable software that keeps growing with your business.
So, whether you need to speed up delivery, improve product quality, or extend your in-house team, we can help.
Feel free to reach out and our team will be happy to see how we can help you.
Ante is a true expert. Another graduate from the Faculty of Electrical Engineering and Computing, he’s been a DECODEr from the very beginning. Ante is an experienced software engineer with an admirably wide knowledge of tech. But his superpower lies in iOS development, having gained valuable experience on projects in the fintech and telco industries.
Ante is a man of many hobbies, but his top three are fishing, hunting, and again, fishing. He is also the state champ in curling, and represents Croatia on the national team. Impressive, right?
What actually drives software development outsourcing costs? From regional rates to tech stack choices, here are the 7 key cost factors explained for 2026.