
How to improve your development team’s productivity
Productivity is perhaps the number one goal for a development team. This article will teach you how to improve development team productivity.
“If you don’t know where you are going, you’ll end up someplace else.”
These are wise words from the American baseball legend Yogi Berra. And the great thing about this quote is that it applies to many areas of life.
That includes managing your development team.
And the way to figure out where your team is headed is through metrics.
Metrics tell you many things about your development team, such as how fast the members write code or the number of errors they spot.
This is indispensable knowledge that can help you optimize their performance.
Here are some of the common metrics you can use to measure your team’s productivity.
Lead time measures how long it takes to release your software from when the client pitches it.
Another way of looking at it is that lead time measures the speed of your development life cycle. That’s because it encompasses all phases, from requirements analysis to launch.
Measuring lead time is straightforward. Whenever you start a project, note the date of your first consultation meeting where you discuss the app concept.
Then, when the app launches, mark that, too. The number of days between these two points is the lead time.
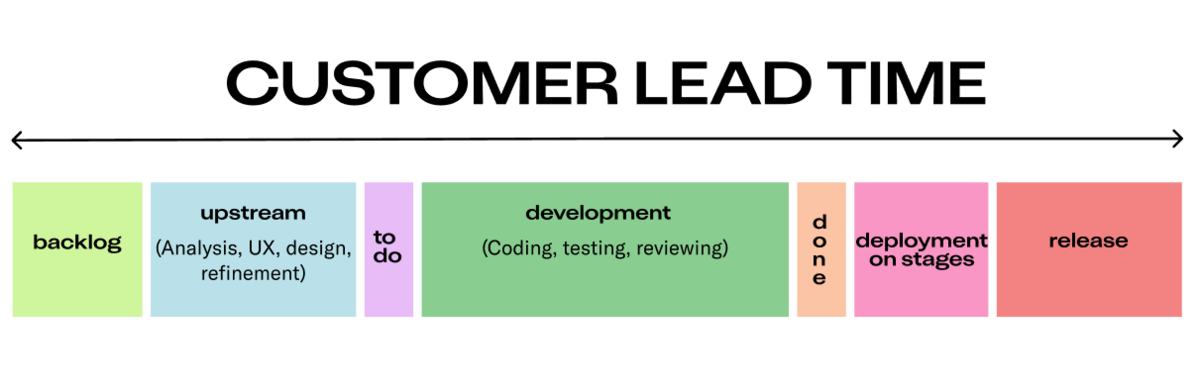
Source: Brainhub
Lead time can be used as a big-picture metric that gives you an idea of the overall effectiveness of everyone involved in the project.
Keep in mind that lead time goes beyond just the development phase. It also includes admin tasks like planning and coordination.
These non-technical factors could also cause a delay that will stretch lead times, even if your development team is efficient.
Excessive waiting between tasks is a common cause of delays. For instance, it might take your QA team an extra day to begin testing a software component.

Make your software product successful with monthly insights from our own Marko Strizic.
These seemingly small delays add up, eventually leading to huge lead times.
Long lead times can also be a problem if your development team is handling multiple projects. That’s because they might not be able to respond to queries immediately.
However, the broad nature of lead times means this metric often has to be used in combination with some other metric to be truly useful and relevant for your development team.
It’s best to pair it with another metric that gets to the root of a problem, such as cycle time.
Cycle time measures how long it takes your development team to complete any coding work, excluding administrative tasks like planning and setting up.
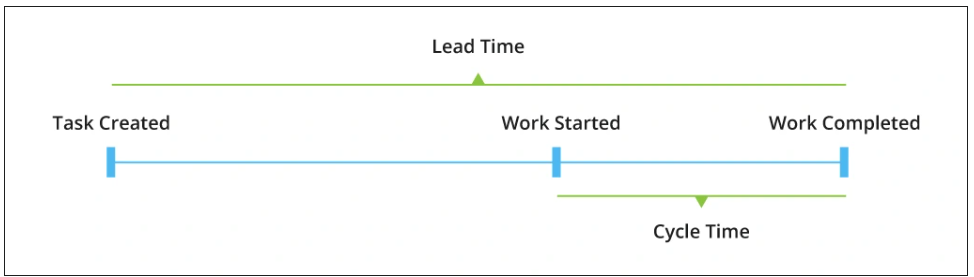
Source: Info Pulse
To measure cycle time, you start the tally when a developer logs a task, then stop the timer when they release their output. The time elapsed is your cycle time. You can easily track this through a project management platform like Asana or Jira.
Cycle time can be further broken down into four components.
Coding time is the time it takes for a developer to work on a piece of code until it’s put into the queue for review. Any delay between this and the actual review is called the pickup time.
When the code is picked up for review, it takes a while for it to get approved. This timeframe is called the review time.
Finally, the time it takes to release an approved code is the deploy time.
You can look at the average times of each phase in the example below:
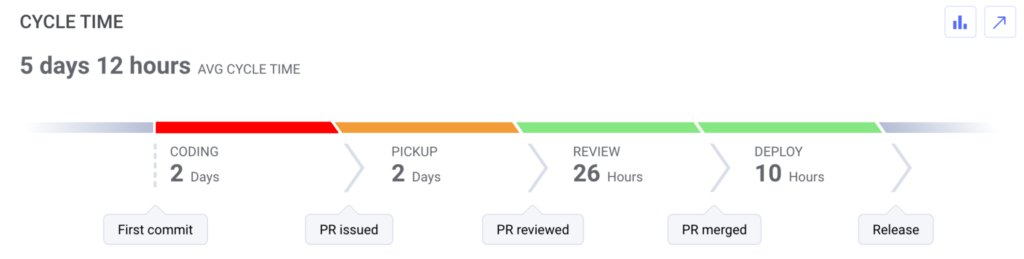
Source: LinearB
Cycle time is the essential performance metric that gauges your development team’s efficiency, skill, and speed. Improving that metric alone can shorten your project time dramatically.
However, note that cycle time isn’t dependent only on the development team’s skills. If the code is inherently challenging, it will require a longer work time.
So, what’s a good cycle time to aim for?
According to research, it would be best if you aimed for a cycle time of around 1.8 days. That’s the cycle time of the top 25% of dev teams surveyed in the report.
The industry-wide average of 3.4 days is still acceptable, but anything beyond that is already a potential red flag.
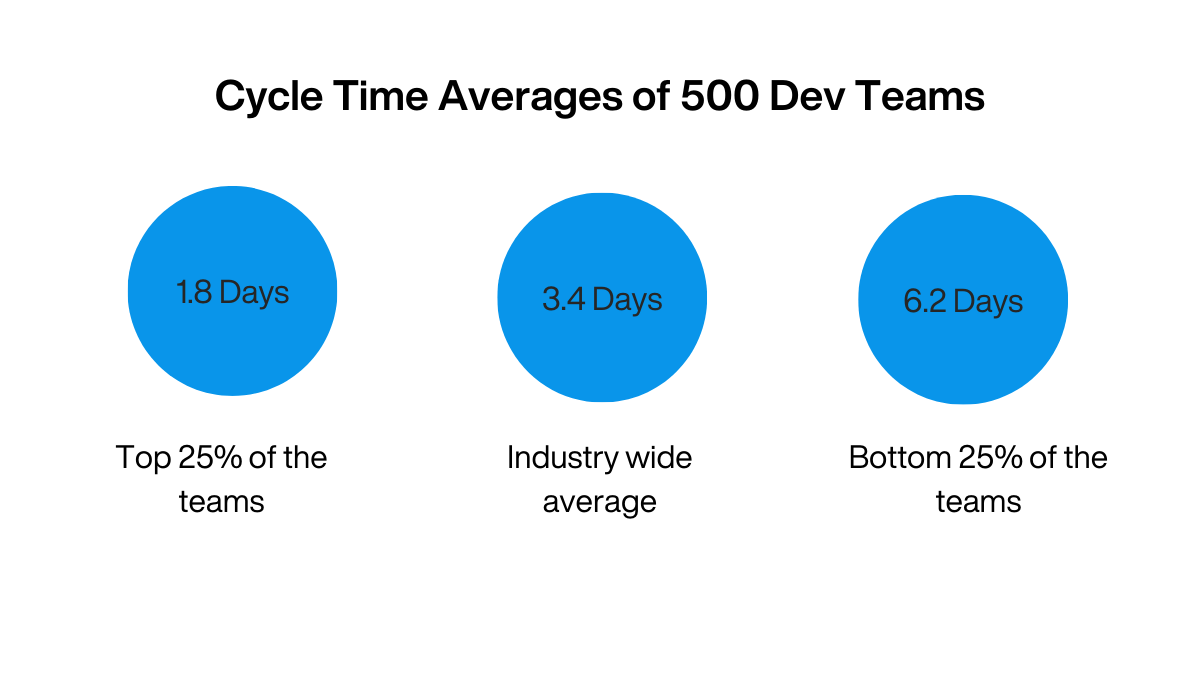
Illustration: DECODE / Data: Code Climate
The best way to use cycle time is as a reference. Measure the cycle time of a few development tasks to establish a baseline.
Then, whenever there are huge variations in the cycle time of subsequent tasks, investigate further.
Velocity measures the amount of work that the development team can finish in a set period. It’s also known as throughput.
The units of measurement used when gauging velocity differ depending on the methodology. For Agile teams like DECODE, we measure the number of completed story points per sprint.
To calculate velocity, divide the number of completed tasks by the total number of days in the desired period.
So, for example, if your team delivered 15 story points in a five-day sprint, your velocity is 3.
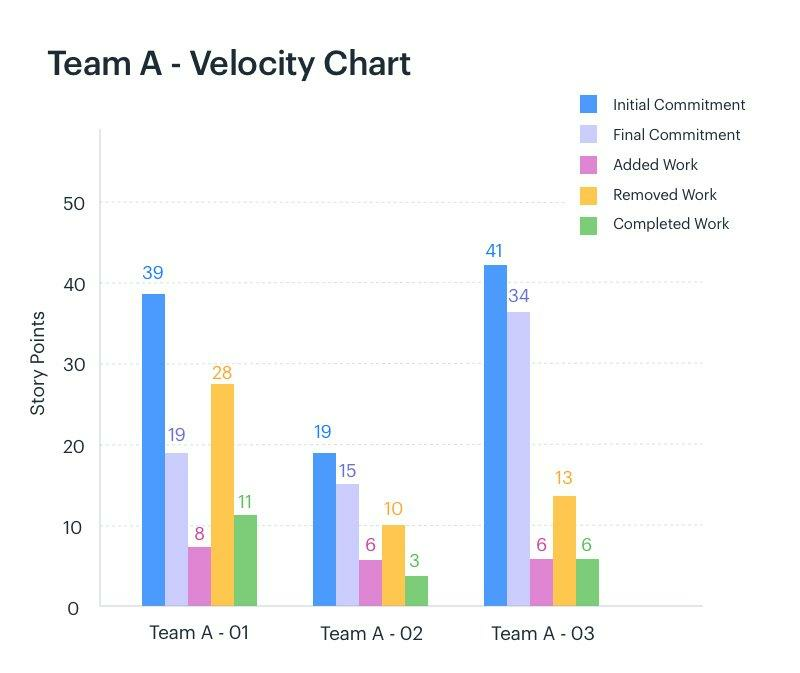
Source: Kissflow
Velocity is primarily a forecasting tool. It tells you the average output of your team in past sprints, so you can better gauge the required time in future sprints.
This knowledge allows you to give better time estimates to clients in future projects.
The metric can also let you make adjustments in real time.
For instance, any long-term irregularities in velocity can also be a sign of potential problems. It might be that the team is experiencing an unexpected challenge or issue.
The good news is that velocity allows you to adjust your deadlines to account for this.
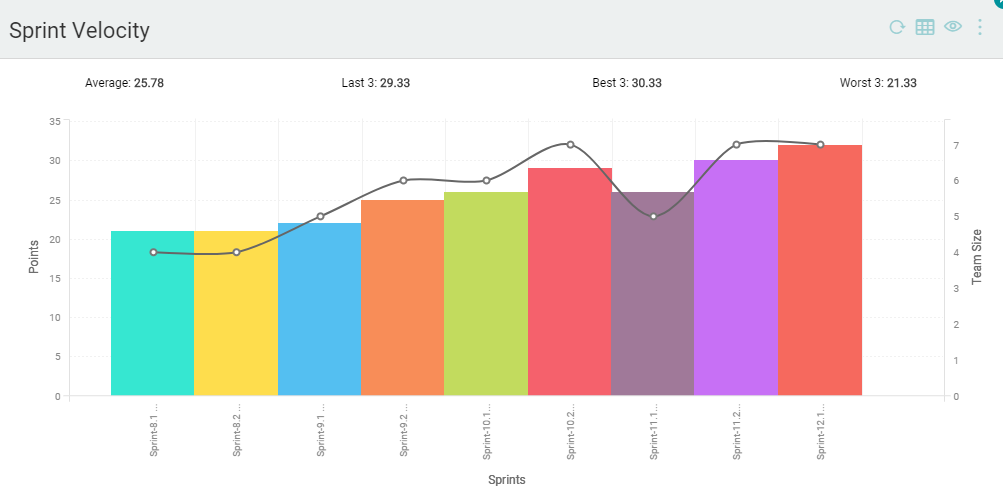
Source: Digite
Overall, velocity can give you an idea of how well your team performs over time. But, like lead time, it’s best in tandem with other metrics to get to the root cause of issues.
Deployment frequency measures how much code your development team can deploy in a period—usually a day or a week, depending on the project size.
Deployment, in this context, happens whenever your team moves a code snippet to production. Thus, it covers both the coding and testing phases.
Measuring deployment frequency is easy. Simply count how many components get pushed into production in a given timeframe, and divide that by the number of days.
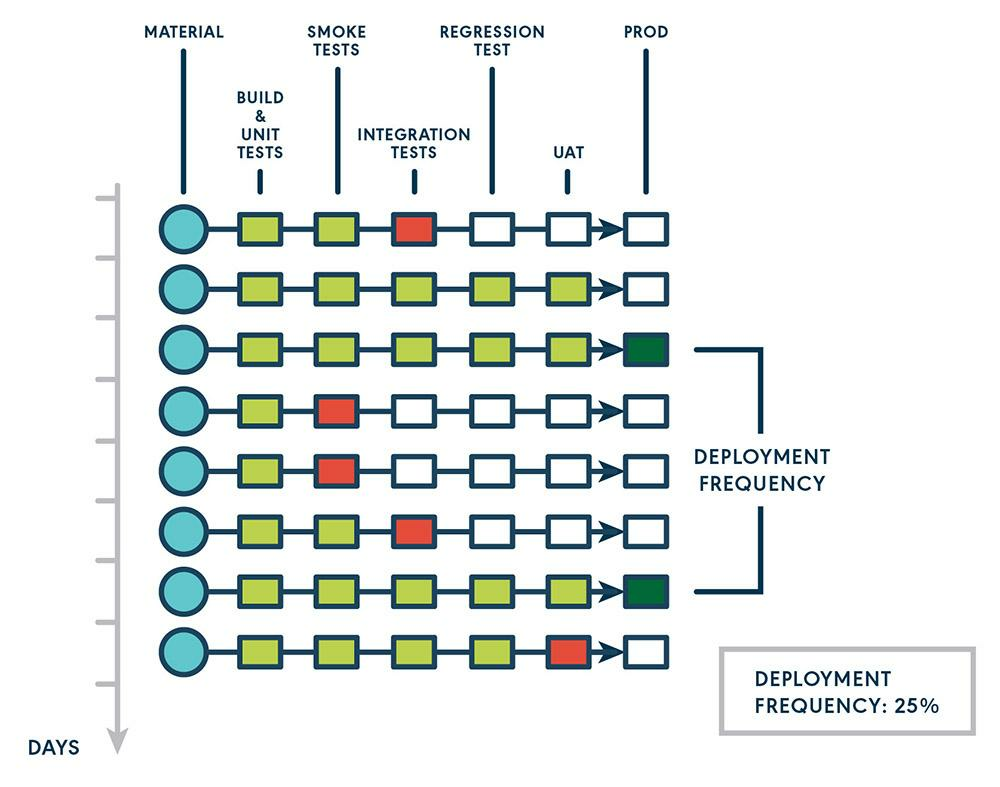
Source: GoCD
Deployment frequency is one of the most critical performance metrics for software teams.
In fact, it’s one of the factors used in Google’s Accelerate State of DevOps 2022 report to separate elite teams from low-performing ones.
According to the authors of the study, the best teams often deploy code on demand several times a day.
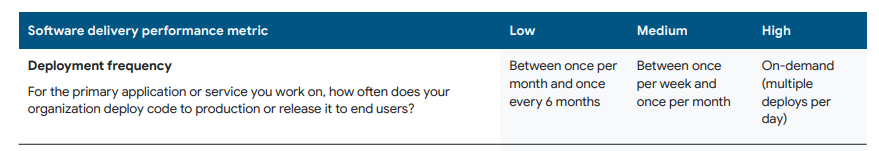
Source: Google
But why is it important?
Having a high deployment frequency means that your team can deliver results much faster, thus leading to shorter development cycles.
Furthermore, more code in production equals more opportunities for testing and feedback.
However, you don’t want to improve your deployment frequency just for the sake of it. You need to balance it with quality as well.
After all, rapidly releasing bug-ridden code will accomplish nothing but make you fail faster.
Code review verifies the code to identify any bugs or issues the developer might have missed. This is also called a pull request.
Code reviews are vital because they help your development team catch more bugs earlier. That could lead to a more stable, secure, and overall better app.
It’s also indispensable for quickly spreading knowledge throughout the team.
Indeed, 76% of developers view code review as a “very valuable” part of the development cycle, according to the 2022 Global DevOps Survey.
You’ll find that there are various metrics you can use to evaluate your team’s code review performance. Below are some provided by GitHub and GitLab.
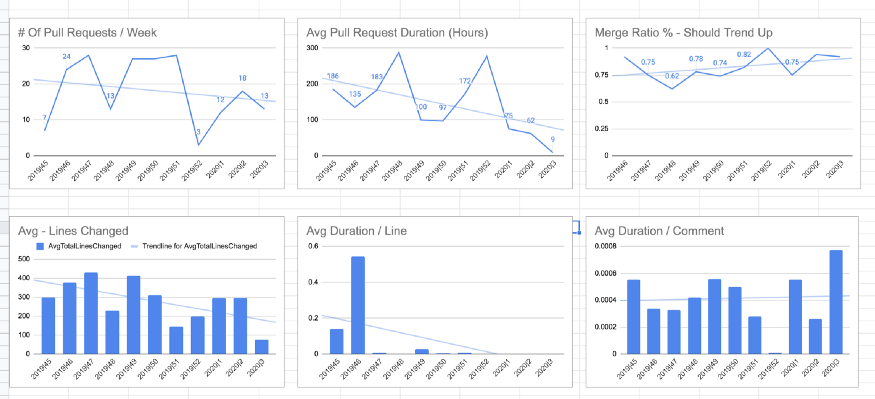
Source: Medium
One good metric to track is time in review, which measures how long each developer takes to fulfill a pull request.
If it’s too short, that could indicate that the team is being insufficiently thorough. But you don’t want it to be too long, either, as it takes time away from other development tasks.
Review cycles constitute another metric which measures how many times a piece of code passes between the developer and reviewer.
You want this to be as low as possible, as frequent back-and-forths will slow down your overall development.
Regardless of which metric you use, it’s vital that you keep your code review process balanced to stay effective.
Code churn refers to how often a developer changes a source code during a specific timeframe.
This includes any revisions, including adding, editing, or deleting lines of code, as the following graph illustrates:
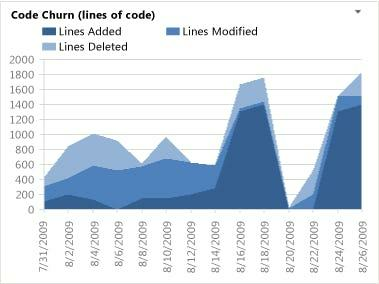
Source: Hatica
There are many ways to measure code churn, but the simplest is this method.
Simply count the number of lines you have deleted and changed, then divide that by the total number of lines you wrote.
So, if you deleted 400 lines of a 1,000-line source code, your churn is 40%.
A high code churn tells you that your team is constantly reworking their source code, which could indicate poor skills or misunderstood project requirements.
Because of this, code churn is vital for measuring actual productivity.
For example, say one of your developers (let’s call them A) wrote 2,000 lines of code but removed 1,500. That’s a code churn of 75%.
Then let’s say developer B wrote only 500 lines of code but only removed 50—giving him a code churn of 10%.
Even if developer A wrote more lines, a big chunk of it was wasted. In this scenario, you could say that developer B was more productive.
Of course, this is just the big picture. There are plenty of legitimate reasons for high code churn, so it’s best to use this metric as a starting point for further analysis.
Code coverage is a QA metric that tells how much of the source code has been evaluated by an automated tester.
Most integrated development environments (IDE) like Microsoft Visual Studio indicate covered code in green and missed code in red.
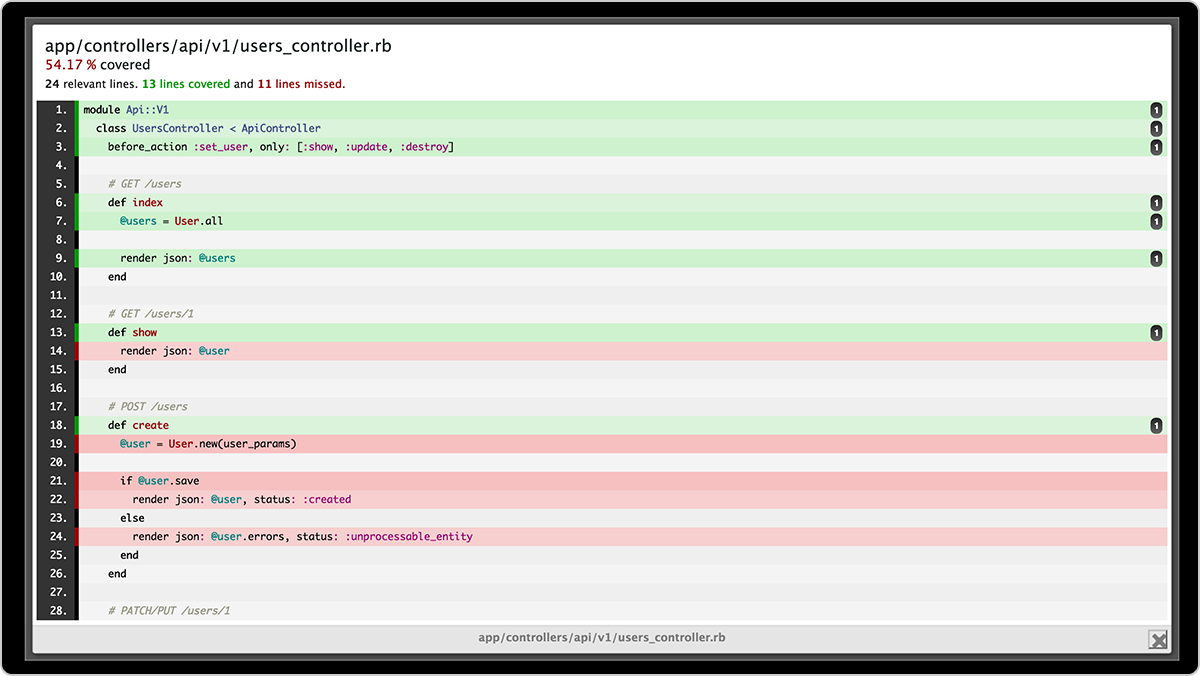
Source: Atlassian
Often, a good portion of a source code isn’t executed in most situations. An example is a conditional statement that only triggers when the app encounters a rare error.
However, untested portions of your source code are dangerous. That’s because they might trigger unexpectedly and produce an unknown result.
Thus, you need to have sufficient code coverage to ensure app stability. In case you’re wondering, 80% is a good target to aim for.
Code coverage also tells you the effectiveness of your automated testing tool and scripts. Your QA team might need to optimize their testing protocols if it’s too low.
Mean time between failures (MTBF) measures the average time between software failures. For example, an MTBF of 10 means your system crashes roughly every ten days.
MTBF is an excellent indicator of app stability and, consequently, the QA skills of your team.
A short MTBF means that the software is very unreliable and full of bugs.
This could reflect the lack of skill of your development team. But it could also indicate other problems like insufficient development time or the wrong tech stack.
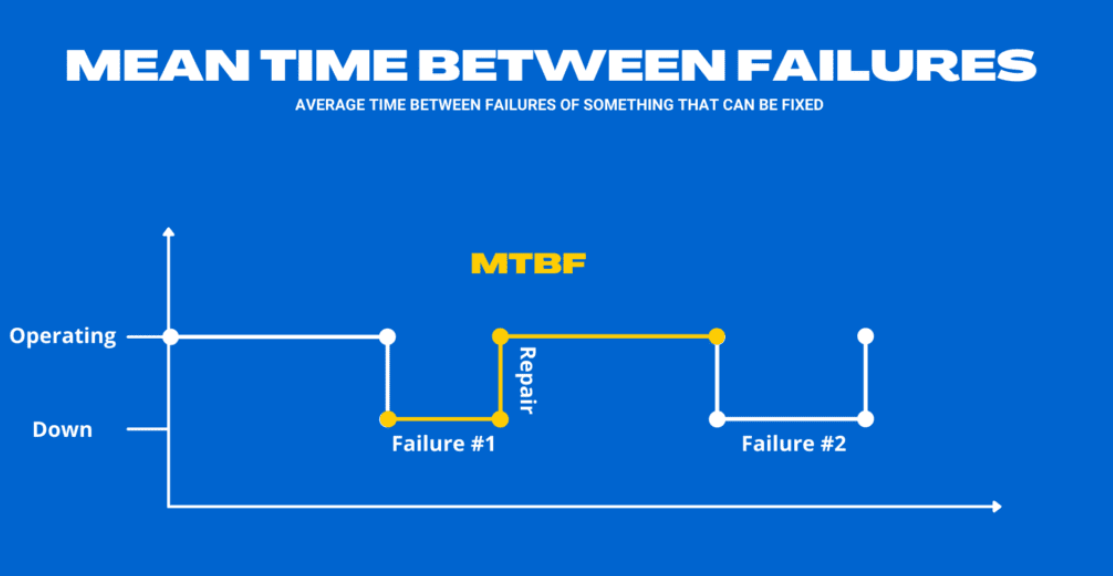
Source: Resco
Your goal, of course, is to increase your MTBF as much as you can. This can be done through rigorous testing before launching an app.
A good preventive maintenance program can also help improve MTBF.
However, be aware that MTBF is a high-level metric that only tells you part of the problem. You need to investigate further or use other metrics to find the root cause.
Mean time to recover (MTTR) measures how soon your team can bring a crashed software back up.
MTTR is measured by dividing the total downtime by the number of failures in a given period.
So if your server crashed five times for a total downtime of three hours, your MTTR—or average repair time—is 36 minutes.
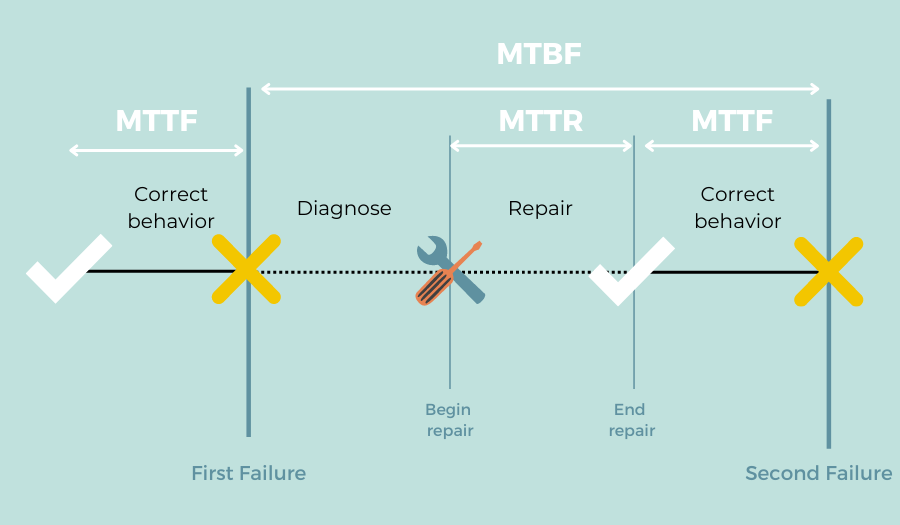
Source: Toucan Toco
MTTR is mostly a responsiveness metric. In other words, it measures how well your development team can respond to errors.
A low MTTR means your development team has the skills and systems necessary to tackle problems immediately.
However, that’s not the entire picture. One of the limitations of MTTR is that it only tells you there’s a problem, but not where it is.
For instance, a faulty alert system can cause a long MTTR.
With that said, what’s a good MTTR? It depends on your industry and the complexity of the software. Generally, an MTTR of five hours or less is a reasonable benchmark.
The truth is that, individually, these performance metrics are quite limited.
They’re truly effective if you use them together. That allows you to hone in on the exact issue hampering your team’s productivity.
Want to know more about managing your development team? We reveal some best practices in this article.

Marko started DECODE with co-founders Peter and Mario, and a decade later, leads the company as CEO. His role is now almost entirely centred around business strategy, though his extensive background in software engineering makes sure he sees the future of the company from every angle. A graduate of the University of Zagreb’s Faculty of Electrical Engineering and Computing, he’s fascinated by the architecture of mobile apps and reactive programming, and a strong believer in life-long learning. Always ready for action. Or an impromptu skiing trip.
Productivity is perhaps the number one goal for a development team. This article will teach you how to improve development team productivity.

In this article, we'll discuss six development team productivity killers.

We’ll teach you how to manage a dedicated software development team successfully. Just follow the guidelines we’ve included in this article.